5
$\begingroup$

In my experiment, I follow up 3 different groups of embryos for 12 timepoints. Each group has about a 100 embryos and I calculate the frequency (continuous variable) for each and tabulate the data for each timepoint, each group as average and SD. I want to compare for significant differences in the frequencies among these 3 groups for all 12 time points.

I feel that the best thing to do here is a Kruskal Wallis test 12 times - once for each hour (timepoint).

  • The distributions aren't normal

  • There are significant number of outliers (since a major chunk of embryos in each group and time have zero frequency)

  • The distributions aren't comparable (histograms don't look similar) amongst the three groups in each timepoint

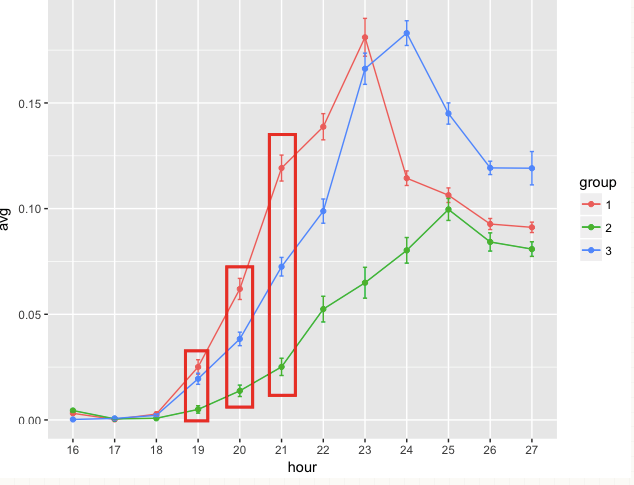
The overall data looks like this - plotted mean frequency of each group for each timepoint (individual distribution of frequencies not shown)

enter image description here

Is there some other test I could use?

Moreover this site mentions that if the distributions aren't similar, the KW test can be used only to compare mean ranks. What would this mean for a continuous variable like frequency?

I need to compare observations within the red box, not across time. But I need to do it for every timepoint. I'm not interested to check for difference across time - it is known that there is a time-dependent pattern to the observations.

$\endgroup$
9
  • $\begingroup$ Do you track the embryos individually or do you just have summary counts at each hour? $\endgroup$
    – whuber
    Commented Nov 29, 2017 at 16:44
  • 2
    $\begingroup$ @whuber I don't track each embryo per se but I count the frequency of every embryo once every hour. So I have the mean, sd and sem of every hour. I don't tag the embryos individually. $\endgroup$
    – Polisetty
    Commented Nov 29, 2017 at 16:53
  • 1
    $\begingroup$ (+1) I find that information relevant because it limits the possible solutions. If embryos could be separately tracked then, for instance, a bootstrap solution would be attractive. This would consist of resampling from the population of all individual embryos, assigning them randomly to the three groups, and plotting the group summaries. Without individual tracking, almost all information is lost about how the observations are non-independent over time. You might be able to compensate by making stronger assumptions, such as adopting an explicit model of temporal dependence. $\endgroup$
    – whuber
    Commented Nov 29, 2017 at 17:11
  • $\begingroup$ @whuber can I get a bootstrap mean and CI for each group's frequency in each time point and compare them? I could do this 12 times. I don't need to check for difference across time, I need to check for difference amongst groups at the same time point. $\endgroup$
    – Polisetty
    Commented Nov 29, 2017 at 18:51
  • 2
    $\begingroup$ That's not going to tell you anything useful due to the dependencies among the results over time. $\endgroup$
    – whuber
    Commented Nov 29, 2017 at 20:32

1 Answer 1

4
+50
$\begingroup$

The Kruskal-Wallis test is appropriate for this scenario. The ranks of embryo frequency will be well-modeled by the KW test as the test does not require a specific distribution. The zeros will result in some ties in the data, which the test is capable of handling.

If you are convinced the distributions are different, you may ask yourself "Why is a statistical test necessary?"

$\endgroup$

Your Answer

By clicking “Post Your Answer”, you agree to our terms of service and acknowledge you have read our privacy policy.

Not the answer you're looking for? Browse other questions tagged or ask your own question.