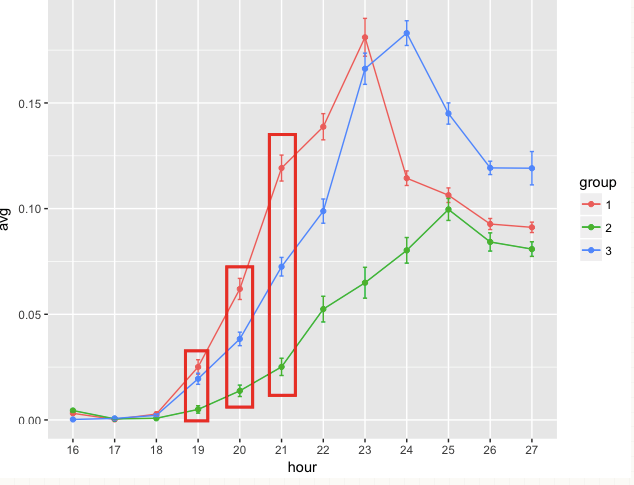
In my experiment, I follow up 3 different groups of embryos for 12 timepoints. Each group has about a 100 embryos and I calculate the frequency (continuous variable) for each and tabulate the data for each timepoint, each group as average and SD. I want to compare for significant differences in the frequencies among these 3 groups for all 12 time points.
I feel that the best thing to do here is a Kruskal Wallis test 12 times - once for each hour (timepoint).
The distributions aren't normal
There are significant number of outliers (since a major chunk of embryos in each group and time have zero frequency)
- The distributions aren't comparable (histograms don't look similar) amongst the three groups in each timepoint
The overall data looks like this - plotted mean frequency of each group for each timepoint (individual distribution of frequencies not shown)
Is there some other test I could use?
Moreover this site mentions that if the distributions aren't similar, the KW test can be used only to compare mean ranks. What would this mean for a continuous variable like frequency?
I need to compare observations within the red box, not across time. But I need to do it for every timepoint. I'm not interested to check for difference across time - it is known that there is a time-dependent pattern to the observations.

