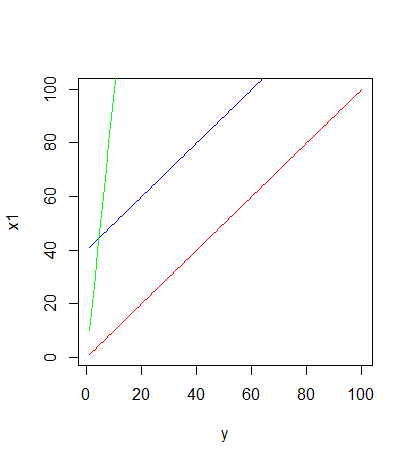
I just plotted some very simple R-Code to illustrate how two lines x1 and x2 can correlate perfectly but estimate very different values. I then got curious and created a third dataset that merely multiplied each value of x1 by ten and, naturally, got a very different slope. I have then calculated the correlations with cor(x1,x3). The correlation between x1 and x3 is still 1 although the plots would led one to believe that they shouldn't. Up until now, I was under the impression that lines that correlate perfectly with each other should be parallel. Did I just discovered that my intuition about correlations was previously wrong or did I miss something?
Is the correlation actually one between each line or did I code something wrong in R?
## Correlation
x1 <- c(1:100)
x2 <- x1+40
x3 <- x1*10

y <- x1

plot( y, x1, col="red", type="l")
lines(y, x2, col="blue")
lines(y, x3, col="green")

cor(x1, x2)  # [1] 1
cor(x1, x3)  # [1] 1
cor(x2, x3)  # [1] 1

