1
$\begingroup$

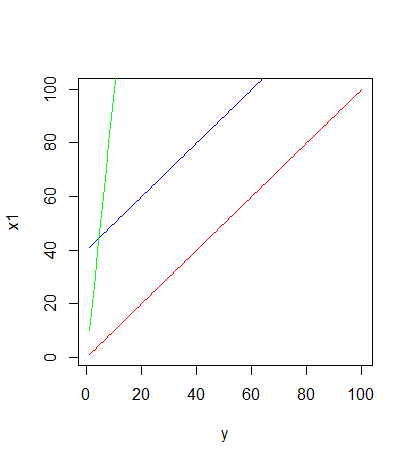
I just plotted some very simple R-Code to illustrate how two lines x1 and x2 can correlate perfectly but estimate very different values. I then got curious and created a third dataset that merely multiplied each value of x1 by ten and, naturally, got a very different slope. I have then calculated the correlations with cor(x1,x3). The correlation between x1 and x3 is still 1 although the plots would led one to believe that they shouldn't. Up until now, I was under the impression that lines that correlate perfectly with each other should be parallel. Did I just discovered that my intuition about correlations was previously wrong or did I miss something?

Is the correlation actually one between each line or did I code something wrong in R?

## Correlation
x1 <- c(1:100)
x2 <- x1+40
x3 <- x1*10

y <- x1

plot( y, x1, col="red", type="l")
lines(y, x2, col="blue")
lines(y, x3, col="green")

cor(x1, x2)  # [1] 1
cor(x1, x3)  # [1] 1
cor(x2, x3)  # [1] 1

enter image description here

$\endgroup$
3
  • $\begingroup$ Please explain what you mean by "lines correlate perfectly" and how you can perceive it from a plot like this. If you want an objective answer to your question about your "intuition about correlations," then you must explain to us what that intuition is. $\endgroup$
    – whuber
    Commented Dec 12, 2017 at 15:10
  • 1
    $\begingroup$ I think you're confusing correlation and agreement (does $y=x$?). . Correlation here is a matter of how far data are linearly related and $y = a + bx$ has the same correlation (namely $1$) as $y=x$ so long as $b$ is positive. As one of many such simple examples Celsius and Fahrenheit temperatures are perfectly correlated but only agree at $-40^\circ$ on either scale. In that and other cases it's fine to calculate correlations between variables with different measurement units (that's more common than not) but there is no sense in which variables expressed in different units can agree. $\endgroup$
    – Nick Cox
    Commented Dec 12, 2017 at 17:43
  • $\begingroup$ Strictly, agree at $-40^\circ$ should be coincide numerically, ignoring units. $\endgroup$
    – Nick Cox
    Commented Dec 12, 2017 at 18:46

1 Answer 1

4
$\begingroup$

I think you are confusing a bit what is happening based on your verbiage.

You call then lines. Yet, what they really are is sets of points: you have 100 points for X1, which we could label $X_{1_1}, X_{1_2},...$ Now you create X2 and X3, which are just linear transforms of X1 - and each, too, has 100 sequenced points.

If you think about correlation graphically, it is really plotting pairs of, say, X1 and X2. Now, given how you built the X's, that set of points will always form a straight line. It doesn't really matter what the slope is, or the offset: if the points plot out to a straight line the correlation is 1.0 If they give a fuzzy blob, the correlation is zero( Or low).

By design, you have made all the X's linear versions of X1. So it is no surprise the lines are straight - that is what happens when correlation equals 1.

The only way you would get a 45 degree line that goes through the origin would be if $X_a$ and $X_b$ were not only perfectly correlated, but equal to each other.

$\endgroup$

Your Answer

By clicking “Post Your Answer”, you agree to our terms of service and acknowledge you have read our privacy policy.

Not the answer you're looking for? Browse other questions tagged or ask your own question.