3
$\begingroup$

I need to make a composite index from the sum of three power-law distributed variables, which vary on different scales and have different variances. For each variable there are many observations with very low scores and few observations with high scores.

I need to normalize the variables to obtain a common scale, before summing them to obtain a single score of the final index. I'm considering two possibilities:

Min-Max Normalization

(Xi - min (X)) / (max(X) - min(X))

Standardization (Z-scores)

(Xi - mean(X)) / std(X)

Which solution is appropriate, given the power-law distribution of the three variables? Or are they both wrong? Why?

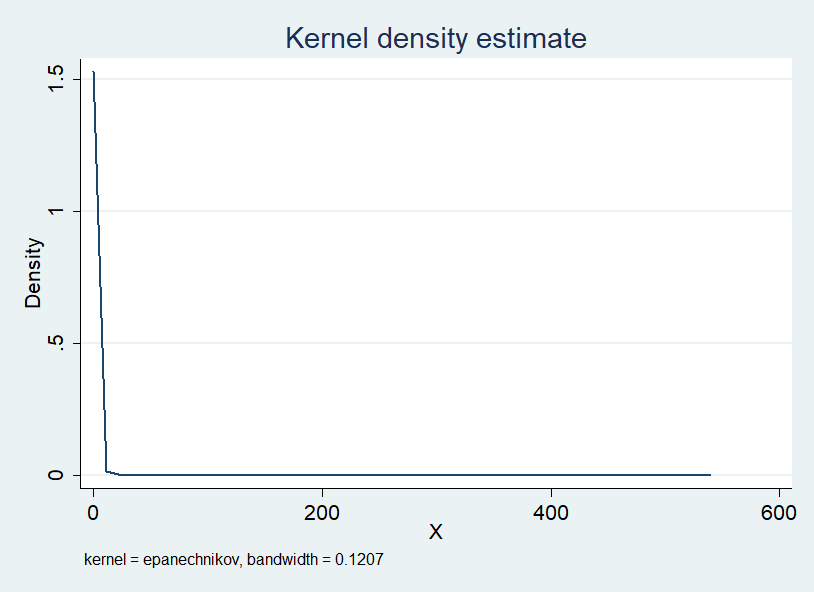
EDIT Please have a look to an example of the distribution I am referring to:

enter image description here

I have three variables distributed like X and I need to normalized them before making a sum of the three.

$\endgroup$
5
  • 1
    $\begingroup$ Why do you think the variables follow a power law when they are the sums of three exponential variates, which do not follow a power law? Have you left something out? $\endgroup$
    – jbowman
    Commented Dec 26, 2017 at 23:23
  • $\begingroup$ "many observations with very low scores and few observations with high scores" would suggest skewed, with a possibly unimodal, perhaps even monotonic density, but none of those things are sufficient for a power law, which says something more specific about the shape. If your variates were ordinary one-parameter exponential and you wanted to render them of comparable scale, dividing by the mean would be the most obvious thing to do. $\endgroup$
    – Glen_b
    Commented Dec 27, 2017 at 4:17
  • $\begingroup$ I think the distribution is a power law. So I edited the question and added a graph. Moreover I never meant that the final index has a power-law distribution. I meant that the variables that I need to sum follow a power-law distribution. They change on different scales, and have different SD. Before summing them I want to normalize them, choosing the best way given their distribution. $\endgroup$ Commented Dec 27, 2017 at 8:51
  • $\begingroup$ Whether one way of standardizing is superior to another one will likely depend on what you plan on doing with your sum score afterwards. $\endgroup$ Commented Dec 27, 2017 at 9:40
  • $\begingroup$ @Stephan thank you. Could you explain more the difference and what you mean? I'm constructing an index for comparison among observations and ultimately for forecasting purposes. $\endgroup$ Commented Dec 27, 2017 at 11:24

1 Answer 1

1
$\begingroup$

Since you wish to use the final sum score for forecasting, I recommend that you cut your dataset into a training and a testing sample. If there is a time dimension, put the last 20% into the test sample; if not, just take a random 20%.

Then fit your model on the training sample: one model with one standardization, the other with the other standardization. Finally, predict into the testing sample with each model. (Be careful to standardize in the test sample using the parameters - like min, max, mean or SD - you derived from the training sample, to mimic the actual "production" use.) Finally, assess which model gives better forecasts, using whatever quality measure or loss function is relevant. You may well find that the differences between the standardization options in terms of forecast quality are negligible.

$\endgroup$
3
  • 1
    $\begingroup$ Thanks a lot Stephan! Indeed this is what I already did and the differences are not much, with a very small preference for min-max normalization. However, I was looking here for an answer about what is theoretically more appropriate, regardless the forecasting purposes. $\endgroup$ Commented Dec 27, 2017 at 12:12
  • 2
    $\begingroup$ I don't think one approach is theoretically more appropriate - at least not based on the information we have. The min and max are of course more volatile, so I personally would expect a mean & SD standardization to perform better, since it won't be dominated by outliers so much. For even more robustness, you could standardize using the median and interquartile range (IQR). $\endgroup$ Commented Dec 27, 2017 at 12:42
  • 1
    $\begingroup$ The answer was really helpful. I think I'll go with Z-scores as you say they are not wrong even if the distribution is non-normal. IQR standardization gives me a couple of problems: (1) sometimes both 75 and 25 percentiles are zero, so IQR = 0 and I have to divide by this number; (2) when I apply this method one variable in the sum gets significantly higher than the others, and so the others become much less relevant for the final score. $\endgroup$ Commented Dec 27, 2017 at 18:56

Your Answer

By clicking “Post Your Answer”, you agree to our terms of service and acknowledge you have read our privacy policy.

Not the answer you're looking for? Browse other questions tagged or ask your own question.