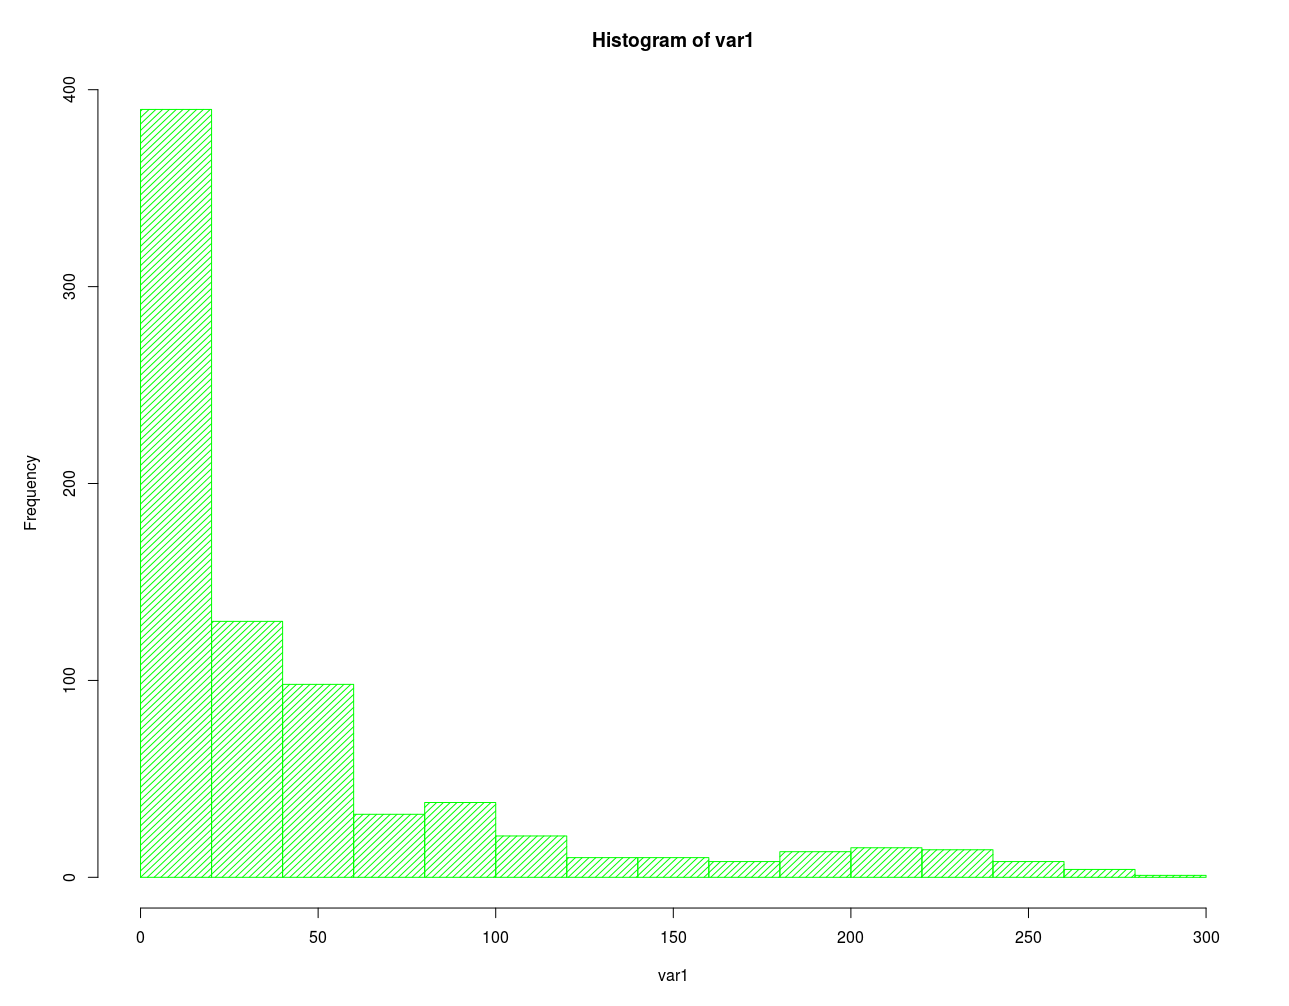
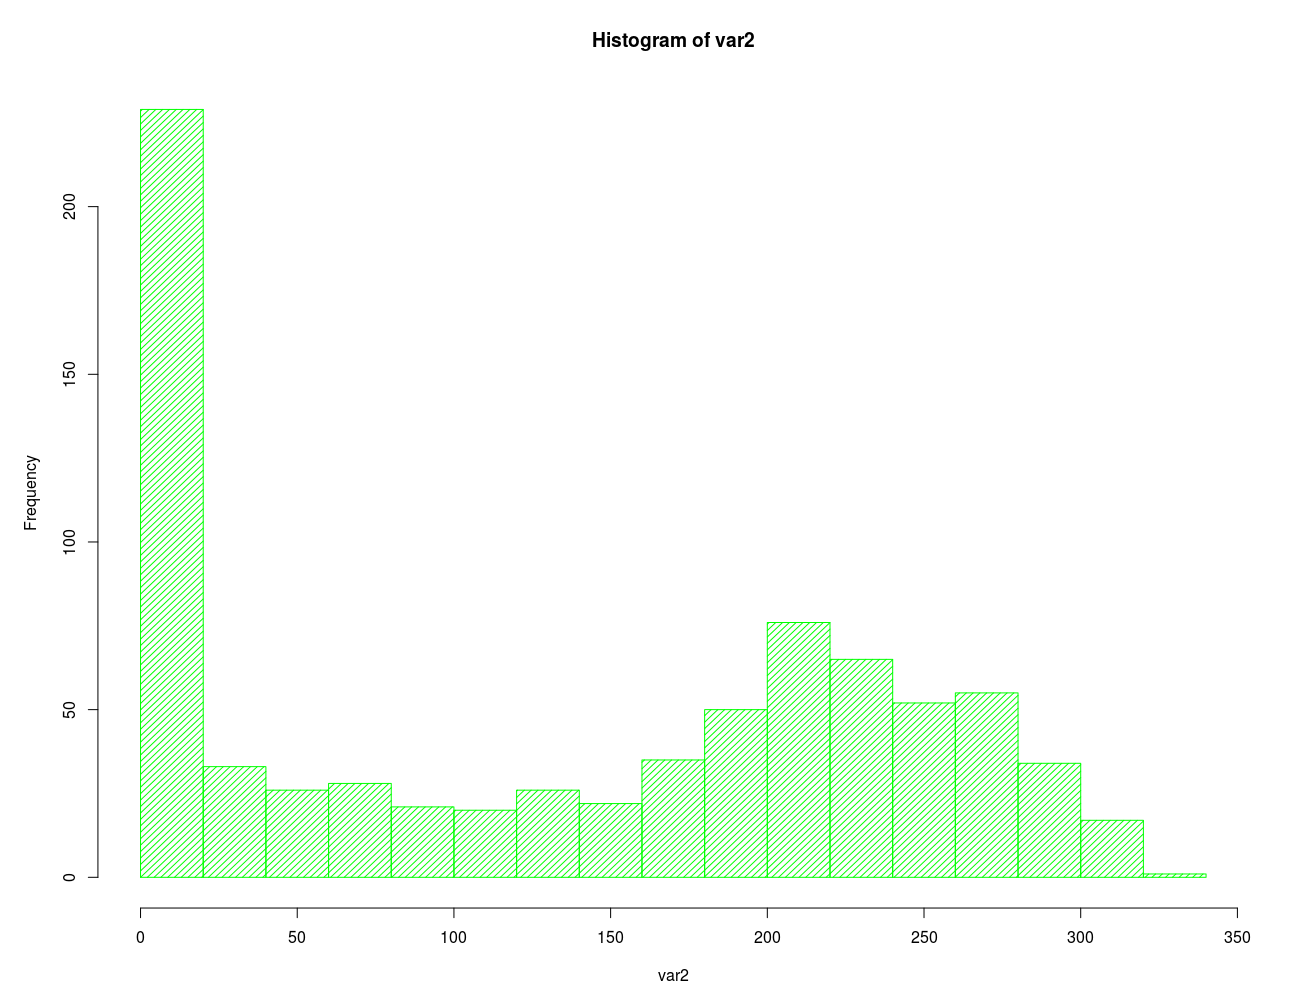
I am looking at modelling a bivariate distribution with observed data from distributions that look like this:
Variable 1's distribution looks like a gamma distribution and variable 2's distribution is a bimodal distribution that can't be modeled using any of the "standard" distributions. Both my marginal distributions are discrete.
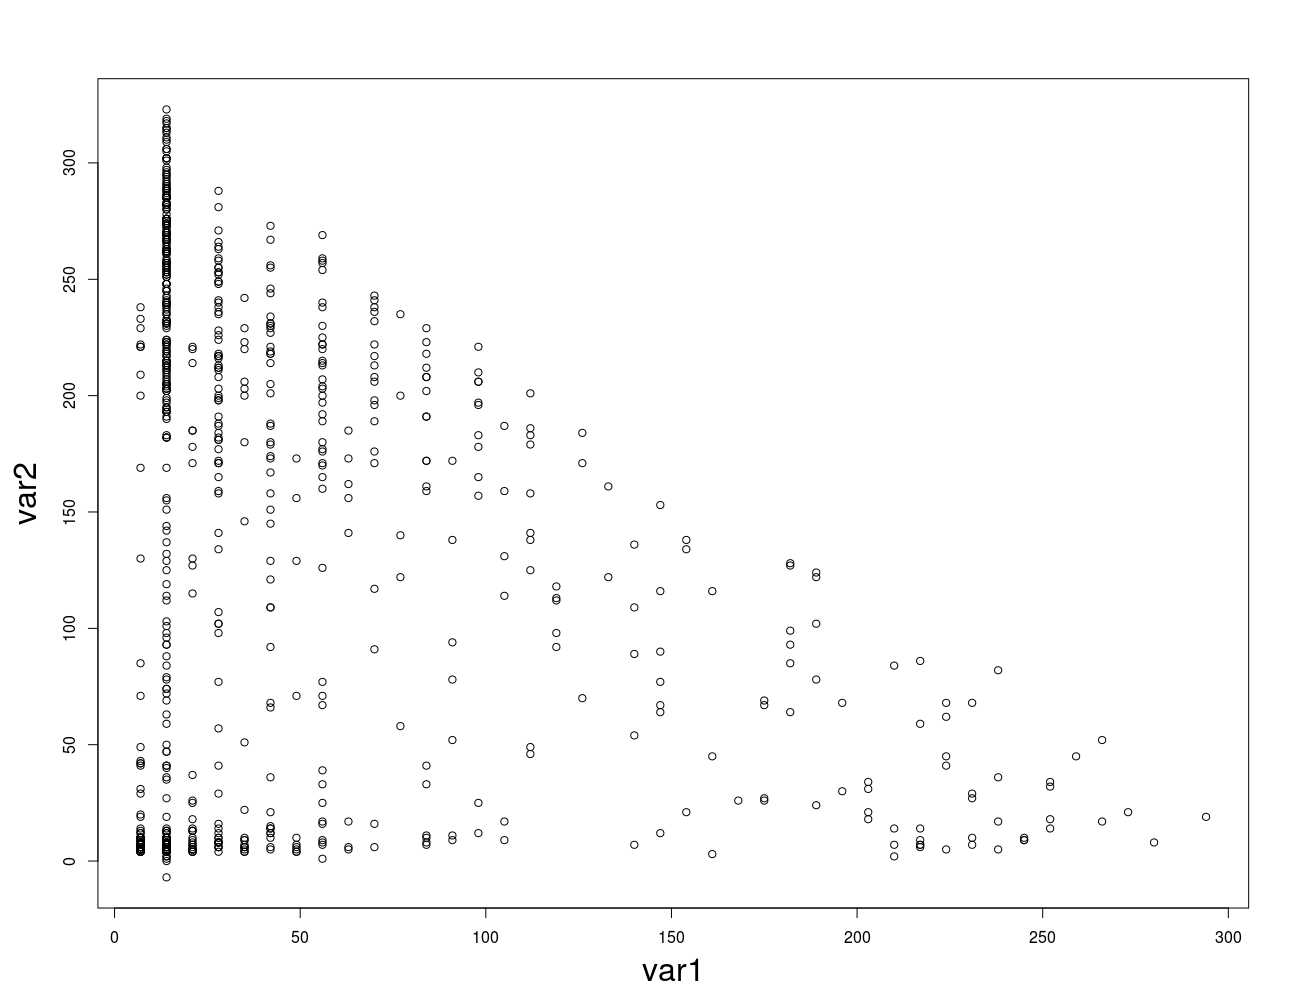
A scatter plot of the two variables look like this:
There seems to be a relationship between the two, as in when variable 1 is around 0, variable 2 tends to be clustered around 0 or between 200 and 320. And other such relationships.
Obviously I don't think the distribution can be modeled using the multivariate normal function in R. But I am at a loss as to how to approximate the distribution. Correlation and covariance measures probably wouldn't be helpful in capturing the relationship either, looking at the scatter graph.
After I approximate the distribution, I would like to sample from the distribution.
I prefer using R or python for this, but if you have suggestions that are implemented in other languages feel free to post them too!
Note, if you are interested in seeing what I have attempted to try and model this:
This is the same data in the previous question I posted:
Copula for non-standard distributions in R
In that question I'm asking about modelling a particular bivariate distribution using copulas.
I figured I should ask a more general question like this, because it looks like using copulas might be overkill because copulas are usually used on higher dimension data and people use it because they want to model the dependency structure and the marginals separately. Given that I am only trying to model a bivariate distribution that I can visualize quite easily, is there a better way to model it?


