26
$\begingroup$

Explain briefly What is meant by interpolation.How is it related to the concept of regression?

interpolation is art of reading between the lines of a table and in elementary mathematics the term usually denotes the process of computing the intermediate values of a function from a set of given or tabular values of that function.

I can't give the answer of second question.

$\endgroup$
1
  • 5
    $\begingroup$ Regression aims at identifying a function to describe the expected value of $Y$ (the dependent variable) given $X$ (the independent variables). Interpolation uses regression for predicting the value of $Y$ at given values of $X$. The difference is subtle but comes to the fore in models where the $Y$'s are correlated, because then the predicted values typically differ from their regression values. Neither regression nor prediction apply directly to interpolating in mathematical tables, which usually are assumed to have no random error, but their algorithms can still be used. $\endgroup$
    – whuber
    Commented Sep 16, 2013 at 15:04

9 Answers 9

33
$\begingroup$

The main difference between interpolation and regression, is the definition of the problem they solve.

Given $n$ data points, when you interpolate, you look for a function that is of some predefined form that has the values in that points exactly as specified. That means given pairs $(x_i, y_i)$ you look for $F$ of some predefined form that satisfies $F(x_i) = y_i$. I think most commonly $F$ is chosen to be polynomial, spline (low degree polynomials on intervals between given points).

When you do regression, you look for a function that minimizes some cost, usually sum of squares of errors. You don't require the function to have the exact values at given points, you just want a good aproximation. In general, your found function $F$ might not satisfy $F(x_i) = y_i$ for any data point, but the cost function, i.e $\sum_{i=1}^n (F(x_i) - y_i)^2$ will be the smallest possible of all the functions of given form.

A good example for why you might want to only aproximate instead of interpolate are prices on stock market. You can take prices in some $k$ recent units of time, and try to interpolate them to get some prediction of the price in the next unit of time. This is rather a bad idea, because there is no reason to think that the relations between the prices can be exactly expressed by a polynomial. But linear regression might do the trick, since the prices might have some "slope" and a linear function might be a good aproximation, at least locally (hint: it's not that easy, but regression is definately a better idea than interpolation in this case).

$\endgroup$
3
  • $\begingroup$ Nice answer. I would add that with regression, there is a statistical model behind it that defines the relation between $Y$ and $X$ in terms of some distribution, where we estimate it's mean (or median, or quantiles etc. in different flavors of regression), e.g. stats.stackexchange.com/questions/173660/… $\endgroup$
    – Tim
    Commented Aug 8, 2016 at 7:52
  • $\begingroup$ Wouldn't the example you've described be extrapolation rather than interpolation? $\endgroup$
    – Scholar
    Commented Feb 18, 2019 at 17:13
  • $\begingroup$ If I understand well, if there are, for instance, 10 data points, then it is impossible to do an interpolation if we consider a polynomial of degree 5? Because it is impossible to satisfy all pairs of data in this case. However sometimes, we try to do polynomial interpolation with a fixed degree. So I am wondering if it is just a confusion about the vocabulary. Maybe we shoud say: polynomial regression for the preivous link? $\endgroup$
    – John Smith
    Commented Jun 22, 2020 at 20:35
6
$\begingroup$

The two previous answers have explained the relationship between linear interpolation and linear regression (or even general interpolation and polynomial regression). But an important connection is that once you fit a regression model you can use it to interpolate between the given data points.

$\endgroup$
3
  • $\begingroup$ So when I regress, say, height against gender I can interpolate to find the expected height of a half-male, half-female! This fanciful example highlights the basic flaw in this response, which is the assumption that all regressors in a regression model must be continuous variables. $\endgroup$
    – whuber
    Commented Jul 4, 2016 at 15:51
  • 2
    $\begingroup$ My answer applies when all the predictor variables are continuous.. $\endgroup$ Commented Mar 18, 2018 at 19:15
  • $\begingroup$ @whuber: Maybe I am missing something, but this answer sounds just like what you wrote in your comment you gave to the question... $\endgroup$
    – Make42
    Commented Feb 1, 2020 at 13:23
4
$\begingroup$

Hopefully this will come rather quickly with a simple example and visualization.

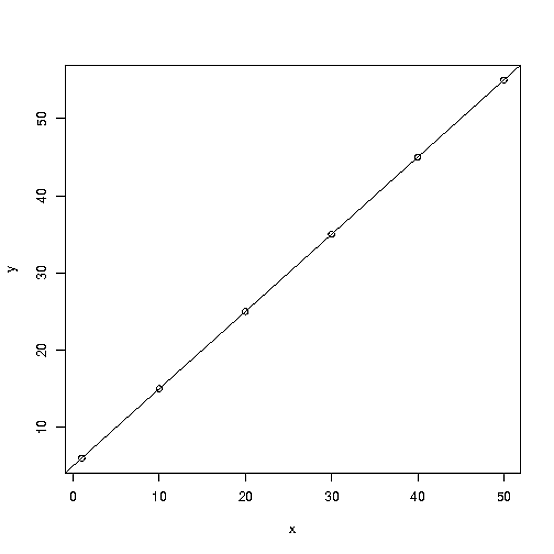
Suppose you have the following data:

X  Y
1  6
10 15
20 25
30 35
40 45
50 55

We may use regression to model Y as a response to X. Using R: lm(y ~ x)

The results are an intercept of 5, and a coefficent for x of 1. Which means an arbitrary Y can be calculated for a given X as X + 5. As a picture, you can see this this way:

enter image description here

Notice how if you went to the X axis, anywhere along it, and drew a line up to the fitted line, and then drew a line over to the Y axis, you can get a value, whether or not I provided a value point for Y. Regression is smoothing over areas with no data by estimating the underlying relationship.

$\endgroup$
3
$\begingroup$

Regression is the process of finding the line of best fit[1]. Interpolation is the process of using the line of best fit to estimate the value of one variable from the value of another, provided that the value you are using is within the range of your data. If it's outside the range, then you would be using Extrapolation[1].

[1] http://mathhelpforum.com/advanced-applied-math/182558-interpolation-vs-regression.html

$\endgroup$
1
  • 2
    $\begingroup$ This answer does not distinguish interpolation from extrapolation. Do you maintain they are the same thing? BTW, mathematics forums (and textbooks and papers, even) generally are not good sources of information about statistical issues, because they tend to focus on narrow mathematical meanings which--although correct and useful in purely mathematical applications--might not apply more widely. $\endgroup$
    – whuber
    Commented Aug 8, 2016 at 14:32
2
$\begingroup$

the basic difference b/w Interpolation and regression is as follows: Interpolation:suppose there are n points (eg:10 data points),in interpolation we will fit the curve passing through all the data points (i.e here 10 data points) with a degree of the polynomial (no.of data points -1; i.e here it is 9).where as in regression not all the data points only a set of them needed for curve fitting.

generally the order of the Interpolation & regression will be (1,2 or 3) if the order is more than 3 ,more oscillations will be seen in the curve.

$\endgroup$
3
  • 2
    $\begingroup$ This implies that interpolation is based on polynomials, but there are several other methods, such as cubic spline, piecewise cubic Hermite, nearest neighbour, etc. $\endgroup$
    – Nick Cox
    Commented Sep 16, 2013 at 7:17
  • $\begingroup$ @Nick Although you are correct, it is curious that every method you name actually is based on polynomials! Perhaps the simplest, best-known non-polynomial interpolator is inverse-distance weighting (IDW). $\endgroup$
    – whuber
    Commented Jul 4, 2016 at 15:53
  • $\begingroup$ @whuber Agreed; if polynomials can be applied with constraints, then most methods qualify, e.g. nearest neighbour = piecewise constant, etc. $\endgroup$
    – Nick Cox
    Commented Jul 4, 2016 at 16:20
1
$\begingroup$

With interpolation or spline fitting what we get is a numeric data (interpolated bet ween each pair of original data) of larger size, which when plotted generates the effect of a smooth curve. In actuality, between each pair of original data a different polynomial is fitted, therefore the entire curve after interpolation is a piece-wise continuous curve, where each piece is formed of a different polynomial.

If one is looking for parametric representation of the original numeric data, regression must be done. You can also try to fit a high degree polynomial to the spline. In any case, the representation is going to be an approximation. You can also check how accurate the approximation is.

$\endgroup$
1
  • $\begingroup$ It appears you did not have a chance yet to read Nick Cox's comment, which points out that not all interpolators are (local) polynomials. $\endgroup$
    – whuber
    Commented Jul 4, 2016 at 15:55
0
$\begingroup$

Both regression and interpolation are used to predict values of a variable(Y) for a given value of another variable(X). In Regression we can predict any value of the dependent variable(Y) for a given value of the independent variable(X) Even if it is outside the range of tabulated values.But in case of Interpolation we can only predict the values of dependent variable(Y) for a value of independent variable(X) which is within the range of given values of X.

$\endgroup$
0
$\begingroup$

Interpolation is the process of fitting a number of points between x=a and x=b exactly to an interpolating polynomial. Interpolation can be used to find the approximate value (or the missing value) of y in the domain x=[a,b] with better accuracy than regression technique.

On the other hand, regression is a process of fitting a number of points to a curve that passing through or near the points with minimal squared error. Regression will not approximate the value of y in the domain x=[a,b] as accurate as interpolation however regression provides better predictions than interpolation for the values of y in the domain between x=(-infinity, a) and x=(b, +infinity).

In summary, interpolation provide better accuracy in the value of y within the domain of a known x range while regression provides better predictions of y in the domain below and beyond the known range of x.

$\endgroup$
2
  • 3
    $\begingroup$ It's not a definition of interpolation that a polynomial is used. Other smooth functions could be appropriate. $\endgroup$
    – Nick Cox
    Commented Feb 18, 2019 at 16:18
  • 3
    $\begingroup$ There are other issues with your claims. For instance, regression can be more accurate than interpolation. The statistical distinction between the two procedures is quite different from what you represent: please see the other posts in this thread. $\endgroup$
    – whuber
    Commented Feb 18, 2019 at 16:19
-1
$\begingroup$

Compared to interpolation, regression takes the uncertainty of measurements into consideration. The pairs of observed values may be noisy.

$\endgroup$

Your Answer

By clicking “Post Your Answer”, you agree to our terms of service and acknowledge you have read our privacy policy.

Not the answer you're looking for? Browse other questions tagged or ask your own question.