0
$\begingroup$

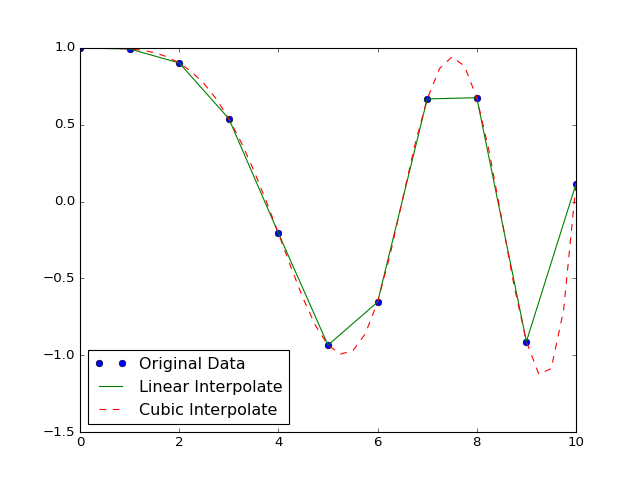
I was playing with the concept of Interpolation in Python and ended up with this plot:

import numpy as np
from scipy.interpolate import interp1d
import matplotlib.pyplot as plt

x = np.linspace(0, 10, num=11, endpoint=True)
cosx = np.cos(-x**2/9.0)
linearInterpolateFunction = interp1d(x, cosx)
cubicInterpoloateFunction = interp1d(x, cosx, kind='cubic')

xnew = np.linspace(0, 10, num=41, endpoint=True)
plt.plot(x, cosx, 'o', xnew, linearInterpolateFunction(xnew), '-', xnew, cubicInterpoloateFunction(xnew), '--')
plt.legend(['Original Data', 'Linear Interpolate', 'Cubic Interpolate'], loc='best')

enter image description here

The way Cubic Interpolation models the function made me think of nonlinear modeling approaches and nonlinear Regression.

Could you please explain to me what are the differences between the two (nonLinear Regression and Cubic Interpolation) and and if I could use Cubic Interpolation for modeling my data? what are the pros and cons to this? If you could provide me with applicable examples, that'd be great.

by the way, I've seen this answer to my question before but does its example on why you better use Regression still count even when using Cubic Interpolation instead of Linear Interpolation ?

Thanks...

$\endgroup$
6
  • 1
    $\begingroup$ Cubic interpolation that honours data points is equivalent to a model with as many parameter values as distinct data points. A perfect fit, but no kind of explanation, yet possibly useful for prediction. Note, however, even in your fairly well-behaved data example, cubic interpolation's willingness to go roller-coaster. In contrast most models provide some kind of smooth structure that mimics general patterns in the data, not exact details. $\endgroup$
    – Nick Cox
    Commented Apr 7, 2016 at 17:14
  • $\begingroup$ Yes, the example stands perfectly for this case too. You just impose some additional smoothness constraints (in the case of cubic interpolation). $\endgroup$
    – usεr11852
    Commented Apr 7, 2016 at 17:17
  • $\begingroup$ Although I'm unsure which of regression, interpolation, nonlinear regression, and cubic splines "the two" refers to, it's important to be aware of their different purposes. Some of these methods aim at understanding or explanation and others at prediction. "Interpolation" is usually meant in the sense of "predict a response at intermediate values of the regressors." $\endgroup$
    – whuber
    Commented Apr 7, 2016 at 17:19
  • $\begingroup$ so... can I use Interpolation for prediction with a high level of confidence compared to other methods? or my example is just too good to show the flaws in Interpolation? if it is flawed, could you please show me an example where Interpolation is flawed compared to (for example) nonlinear regression methods? $\endgroup$
    – Cypher
    Commented Apr 7, 2016 at 17:38
  • $\begingroup$ I found my answer but the only thing still bugging me is if we could use Cubic Interpolation when trying to predict inside the domain of the original function ? could it be as good as other methods? $\endgroup$
    – Cypher
    Commented Apr 7, 2016 at 17:57

1 Answer 1

0
$\begingroup$

I was completely unaware of one important fact : Interpolation only works in the data domain it was provided with. in this case it is 11 points between 0 and 10... anything out of this domain results in an error...

Just changing this :

xnew = np.linspace(0, 10, num=11, endpoint=True)

to this :

xnew = np.linspace(0, 11, num=11, endpoint=True)

results in an error...

Interpolation seems to be unable to take even 1 more step than what it was already provided with... if I try to Interpolate out of the domain range, I will get an error (which makes sense to me now!).

Thank you all... I wasn't aware of the fundamental characteristics of Interpolation... Sorry!

$\endgroup$

Not the answer you're looking for? Browse other questions tagged or ask your own question.