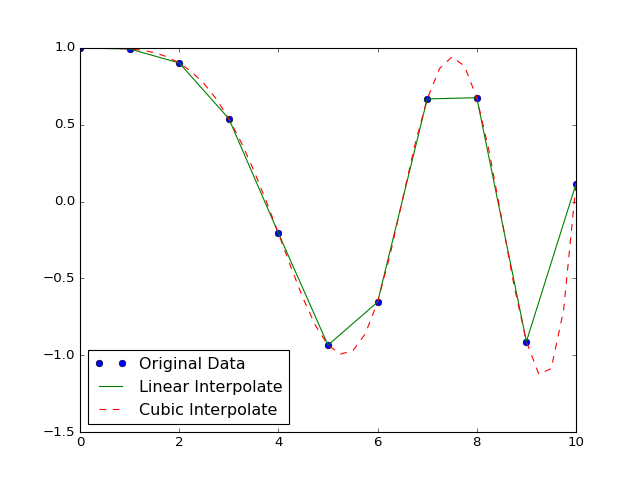
I was playing with the concept of Interpolation in Python and ended up with this plot:
import numpy as np
from scipy.interpolate import interp1d
import matplotlib.pyplot as plt

x = np.linspace(0, 10, num=11, endpoint=True)
cosx = np.cos(-x**2/9.0)
linearInterpolateFunction = interp1d(x, cosx)
cubicInterpoloateFunction = interp1d(x, cosx, kind='cubic')

xnew = np.linspace(0, 10, num=41, endpoint=True)
plt.plot(x, cosx, 'o', xnew, linearInterpolateFunction(xnew), '-', xnew, cubicInterpoloateFunction(xnew), '--')
plt.legend(['Original Data', 'Linear Interpolate', 'Cubic Interpolate'], loc='best')
The way Cubic Interpolation models the function made me think of nonlinear modeling approaches and nonlinear Regression.
Could you please explain to me what are the differences between the two (nonLinear Regression and Cubic Interpolation) and and if I could use Cubic Interpolation for modeling my data? what are the pros and cons to this? If you could provide me with applicable examples, that'd be great.
by the way, I've seen this answer to my question before but does its example on why you better use Regression still count even when using Cubic Interpolation instead of Linear Interpolation ?
Thanks...

