I am working with various different data sets (in the context of forest reclamation on industrial disturbed landscapes) that contain percent cover values of desired (planted) and undesired plant species (mostly weeds that came in due to land disturbance).
I have a feeling that certain undesired plant species negatively affect the growth of planted desired species. I don't have a proper experiment set up to specifically test my "hypothesis" but I have access to many vegetation surveys collected over the past couple of years in the similar locations.
Now before I attempt the propose a dedicated experiment testing my hypothesis explicitly, I would like to look for relationships in the available data sets first and I am not primarily interested whether things are significant or not. Instead I would like to look for simple trends first.
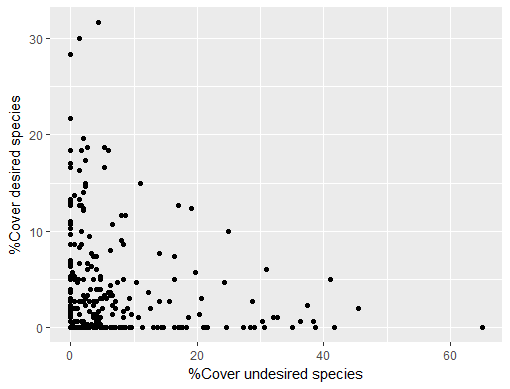
Here is an example plot of the data I am working with (however it can also look much different):

By looking at this graph, it seems as if there is a negative (non-linear) relationship. I also ran Spearman's rank correlation on it, which supports what I hypothesized:
    Spearman's rank correlation rho

data:  %Cover undesired species and %Cover desired species
S = 4073700, p-value = 0.01243
alternative hypothesis: true rho is not equal to 0
sample estimates:
       rho
-0.1500179
However, I am not sure if this test is reasonable in the context of the data (many zeros). Again, this is only to explore the available data sets for these relationships and see whether my feeling can be substantiated. One way would be to simply create many scatter plots as above and study those individual plots. However, given the amount of data to go through, a single value, like a correlation coefficient, that describes that data would be best. Alternatively, I could somehow deal with / eliminate the zeros and run a beta regression for example and look at the slope of the relationship. How about non-linear regression? Would this be more reasonable?
Any ideas or suggestions of how to approach this?
