3
$\begingroup$

I am working with various different data sets (in the context of forest reclamation on industrial disturbed landscapes) that contain percent cover values of desired (planted) and undesired plant species (mostly weeds that came in due to land disturbance).

I have a feeling that certain undesired plant species negatively affect the growth of planted desired species. I don't have a proper experiment set up to specifically test my "hypothesis" but I have access to many vegetation surveys collected over the past couple of years in the similar locations.

Now before I attempt the propose a dedicated experiment testing my hypothesis explicitly, I would like to look for relationships in the available data sets first and I am not primarily interested whether things are significant or not. Instead I would like to look for simple trends first.

Here is an example plot of the data I am working with (however it can also look much different): enter image description here
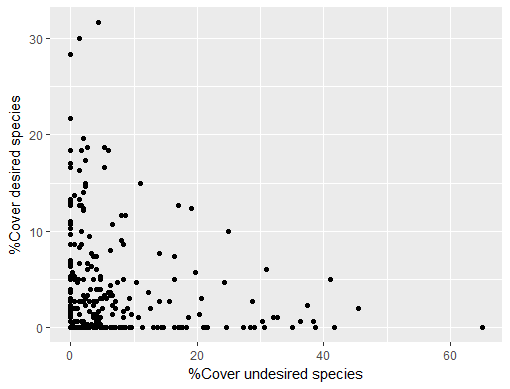
By looking at this graph, it seems as if there is a negative (non-linear) relationship. I also ran Spearman's rank correlation on it, which supports what I hypothesized:

    Spearman's rank correlation rho

data:  %Cover undesired species and %Cover desired species
S = 4073700, p-value = 0.01243
alternative hypothesis: true rho is not equal to 0
sample estimates:
       rho 
-0.1500179 

However, I am not sure if this test is reasonable in the context of the data (many zeros). Again, this is only to explore the available data sets for these relationships and see whether my feeling can be substantiated. One way would be to simply create many scatter plots as above and study those individual plots. However, given the amount of data to go through, a single value, like a correlation coefficient, that describes that data would be best. Alternatively, I could somehow deal with / eliminate the zeros and run a beta regression for example and look at the slope of the relationship. How about non-linear regression? Would this be more reasonable?

Any ideas or suggestions of how to approach this?

$\endgroup$
5
  • 1
    $\begingroup$ Just some thoughts: I think using Spearman correlation is a decent way to show there is a relationship. I'm wondering if because there are so many ties in ranks for the zeros, if Kendall correlation is a better alternative. The beta regression idea might work as well. One thought I had was to use quantile regression to model the median. $\endgroup$ Commented Apr 14, 2018 at 16:42
  • $\begingroup$ Thanks @SalMangiafico ! These are good suggestions. I will see how they compare on the same data set. $\endgroup$
    – Stefan
    Commented Apr 15, 2018 at 1:52
  • 3
    $\begingroup$ Be very careful about how you interpret such data. Because the species are mutually exclusive and together comprise a substantial part of the cover, for this purely mathematical reason they are likely to exhibit a negative relationship. After all, when one is high the other cannot be, and vice versa. If by "negatively affect the growth" you intend to draw a less trivial conclusion, then you might need to look harder at these data--or even collect data in a different way altogether (such as by performing a longitudinal study). $\endgroup$
    – whuber
    Commented Apr 15, 2018 at 16:21
  • 1
    $\begingroup$ Thank you @whuber for your comment! Yes this is a very good point and I agree that a dedicated study is needed to test this hypothesis. In forest reclamation, reestablishing tree cover to ensure timely canopy closure is often comprised by aggressive weeds which out-compete planted trees for light as well as below and above ground space. Now some people in the field think that weed X needs to be actively managed while others think it's weed Y. For that reason, I thought screening present data might be helpful before proposing a new study ... $\endgroup$
    – Stefan
    Commented Apr 15, 2018 at 16:58
  • $\begingroup$ ...After all it's hard to get research funding from industry without exhausting the available resources (i.e. already present vegetation surveys). As of now, I am thinking of presenting 2 to 3 parameters that measure "relationships" and see how those change over time after planting the site but at the same time highlighting the limitations of such data to reach firm conclusions. $\endgroup$
    – Stefan
    Commented Apr 15, 2018 at 16:58

0

Your Answer

By clicking “Post Your Answer”, you agree to our terms of service and acknowledge you have read our privacy policy.