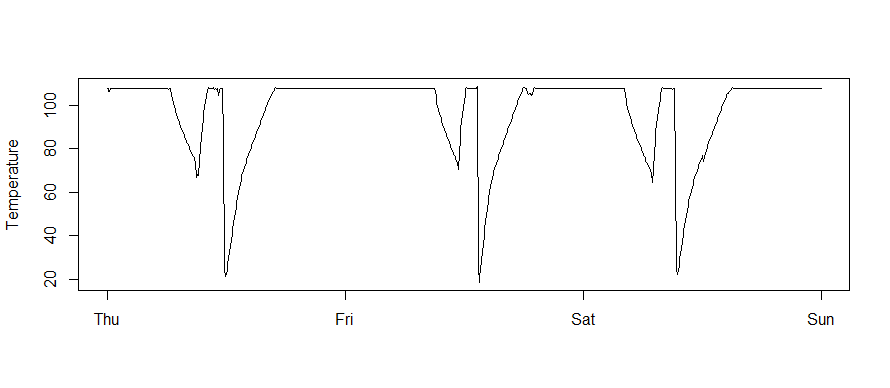
Assuming you don't have any long term trend in your data, then you extract the daily pattern you are looking for by calculating the average over 20 days for each 5 minute interval. This would smooth out any day-to-day variances and show daily a pattern in your data (if there is one).
Consider a simple example with 3 days of data, measured at 4 hours intervals:
D1-4:00  D1-8:00    D1-12:00    D1-16:00    D1-20:00    D1-24:00
  4        11        15.5         17           8           6
D2-4:00  D2-8:00    D2-12:00    D2-16:00    D2-20:00    D2-24:00
  6        9          16          14          8.5          7
D3-4:00  D3-8:00    D3-12:00    D3-16:00    D3-20:00    D3-24:00.
  5.5     9.5         14          14          14           2
Although some daily pattern is visible in this data, it is not very clear and there is a lot of daily variance. But if you calculate the average over 3 days for each two hour period:
4:00    8:00.   12:00  16:00   20:00   24:00
5.16    9.83    15.16    15    10.16     5
The pattern becomes much clearer.
You can do the same thing with your data, by averaging the value for every 5 minutes across 20 days.
If your data has a trend in it, then you need to detrend it first.

