0
$\begingroup$

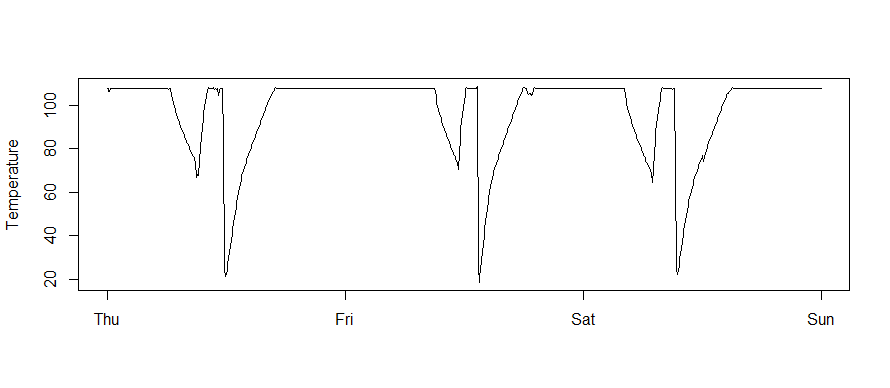
Data : I have a time series of temperature values every 5 minutes for 20 days. There is a common pattern across each day.

Question : What kind of pattern extraction or machine learning algorithm should be used to obtain a 'standard pattern / profile' of each day from this data ?

The idea is to compare deviations on future days from this 'standard pattern'.

I am unsure what should be the approach to solve this problem.

Sample daily temperatures are as follows: enter image description here

$\endgroup$
3
  • $\begingroup$ Maybe search this site for clustering of time series? And tell us a little more about your data $\endgroup$ Commented Apr 14, 2018 at 13:00
  • $\begingroup$ Is there a long term trend in your data? Does the average daily temperature increase or decrease or is it stable? $\endgroup$
    – Skander H.
    Commented Apr 14, 2018 at 15:04
  • $\begingroup$ You don't need machine learning here. A simple correlogram will work $\endgroup$
    – Aksakal
    Commented Apr 16, 2018 at 21:44

1 Answer 1

1
$\begingroup$

Assuming you don't have any long term trend in your data, then you extract the daily pattern you are looking for by calculating the average over 20 days for each 5 minute interval. This would smooth out any day-to-day variances and show daily a pattern in your data (if there is one).

Consider a simple example with 3 days of data, measured at 4 hours intervals:

D1-4:00  D1-8:00    D1-12:00    D1-16:00    D1-20:00    D1-24:00
  4        11        15.5         17           8           6
D2-4:00  D2-8:00    D2-12:00    D2-16:00    D2-20:00    D2-24:00
  6        9          16          14          8.5          7
D3-4:00  D3-8:00    D3-12:00    D3-16:00    D3-20:00    D3-24:00. 
  5.5     9.5         14          14          14           2

Although some daily pattern is visible in this data, it is not very clear and there is a lot of daily variance. But if you calculate the average over 3 days for each two hour period:

4:00    8:00.   12:00  16:00   20:00   24:00
5.16    9.83    15.16    15    10.16     5

The pattern becomes much clearer.

You can do the same thing with your data, by averaging the value for every 5 minutes across 20 days.

If your data has a trend in it, then you need to detrend it first.

$\endgroup$

Your Answer

By clicking “Post Your Answer”, you agree to our terms of service and acknowledge you have read our privacy policy.

Not the answer you're looking for? Browse other questions tagged or ask your own question.