4
$\begingroup$

Quick and possibly quite silly question:

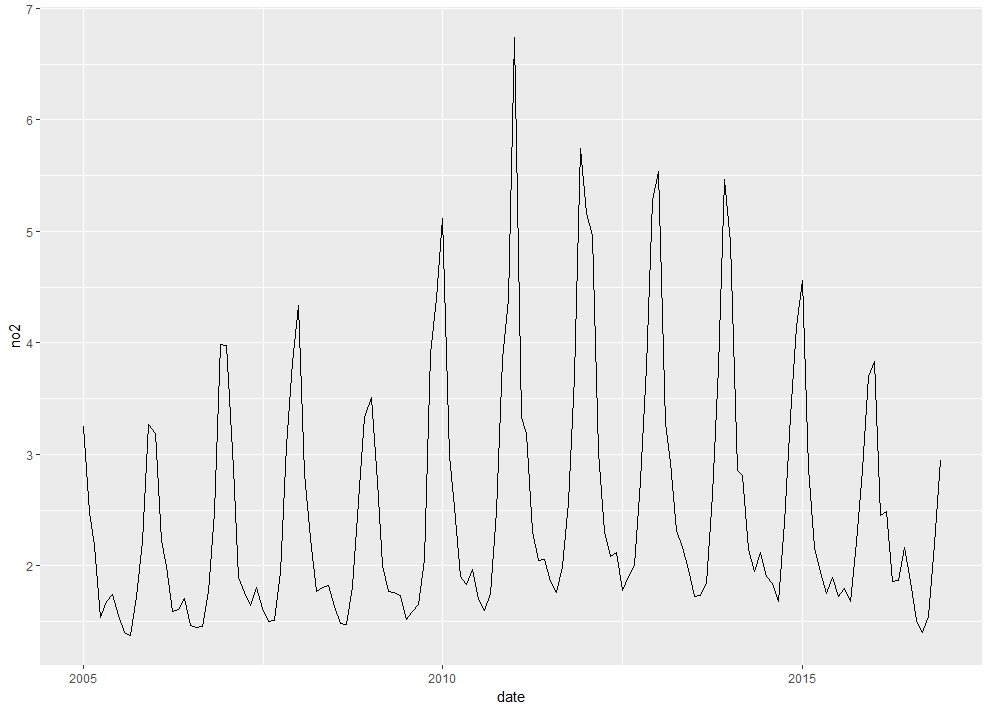
So I have this time series, there is obviously large seasonality, with observations in winter much higher than in summer. There is also an overall inverse-U-shaped trend, but the change in winter levels is much more prominent than change in summer levels. Now my question is - can this be called seasonal heteroskedasticity? Overall, the winter months do have a higher variance, but what I mean in particular is that they change more year-to-year than the summer months (e.g. the average in Jan rose by 107% 2005-2011, to then decrease by 43% by the end of 2015, in the same periods average in Aug rose by 25% and decreased by 14% respectively). Alternatively, is there another term for such pattern?

$\endgroup$
2
  • $\begingroup$ Consider working on logarithmic scale. It's not going to make a big difference, but it might help a bit. $\endgroup$
    – Nick Cox
    Commented May 3, 2018 at 17:10
  • $\begingroup$ thanks for the advice, though I'm already using log scale (it just doesn't make a difference) $\endgroup$
    – yassem
    Commented May 3, 2018 at 20:22

2 Answers 2

2
$\begingroup$

It looks like the unconditional variance of winter months is higher than the unconditional variance of summer months. If you calculate the variance of all Decembers vs. the variance of all Junes, you will see a considerable difference. Calling it seasonal heteroskedasticity seems quite natural to me.

$\endgroup$
0
0
$\begingroup$

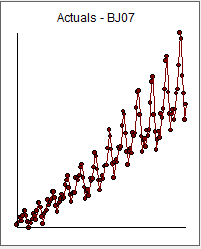
The original series appears to be heterogeneous whereas the errors from a useful model may not be. Only the data knows for sure. If you post you data I will try and help you. The original airline series looks like this

enter image description here

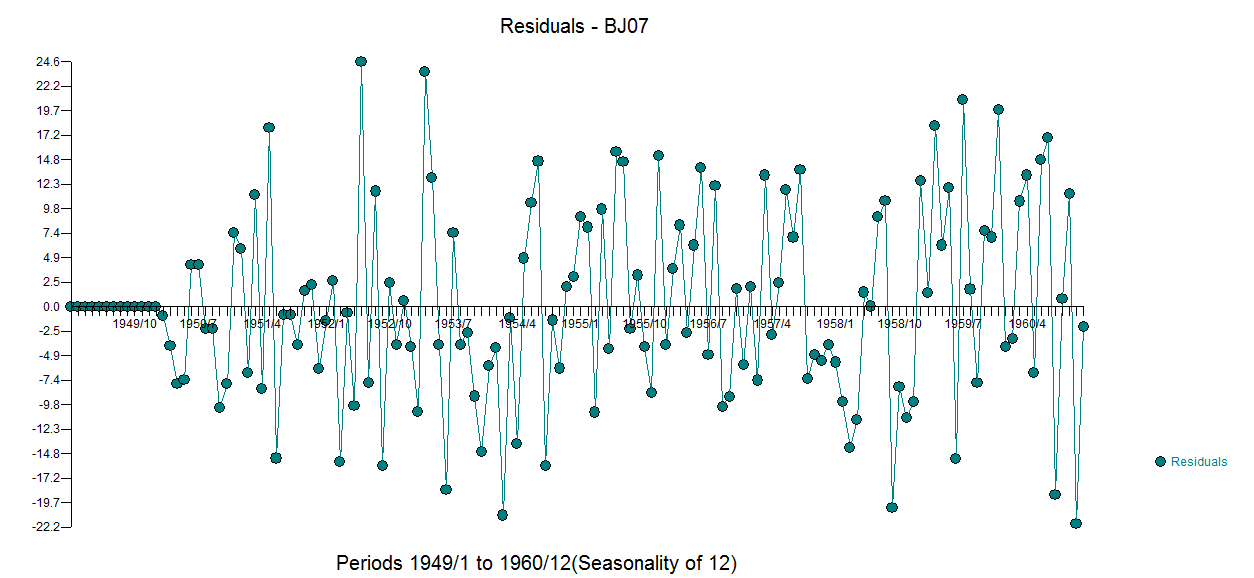
whereas after differencing and an ar coefficient and treatment for two anomalies this is the plot of the adjusted Y, i.e. the residuals.

enter image description here

The variance of the original series has no meaning or implication (other than descriptive) as all parametric assumptions are based upon the variance of the errors .

The plot of the errors suggests a possible deterministic change in the variance of the errors implying the need for a "weighted approach" ala https://pdfs.semanticscholar.org/09c4/ba8dd3cc88289caf18d71e8985bdd11ad21c.pdf

$\endgroup$

Your Answer

By clicking “Post Your Answer”, you agree to our terms of service and acknowledge you have read our privacy policy.

Not the answer you're looking for? Browse other questions tagged or ask your own question.