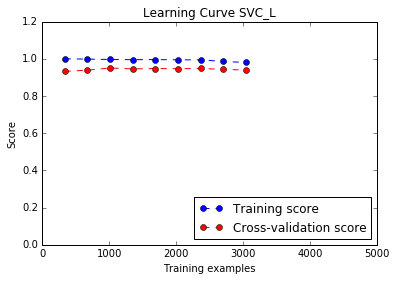
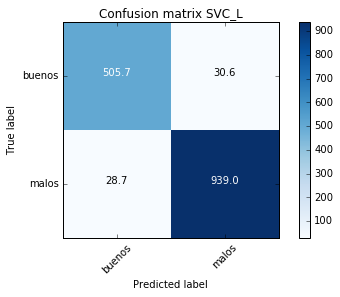
I am training a SVM with linear kernel over a training set of 3759 elements. The dimension of my problem is 2055, in other words, each example belonged to my training set is described by 2055 features. When I plot the learning curves, I got the curves of the figure. How can I interpret this image and evaluate my model? I really consider that obtaining a very high precision in the testing set at the very beginning is not usual.
Average of 30 runs


