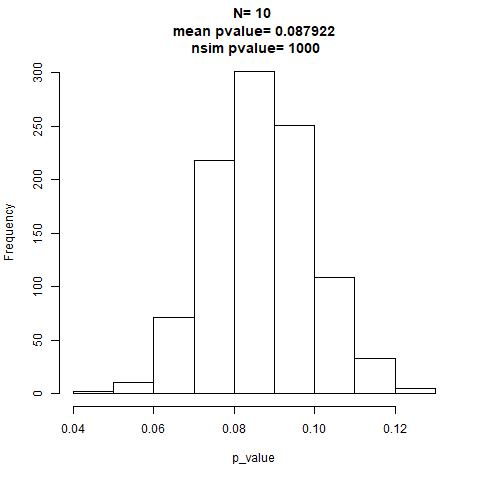
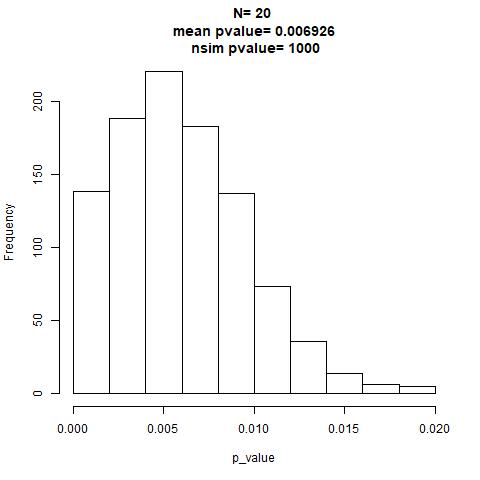
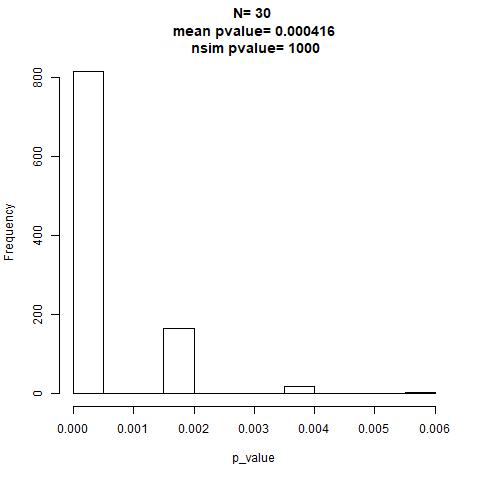
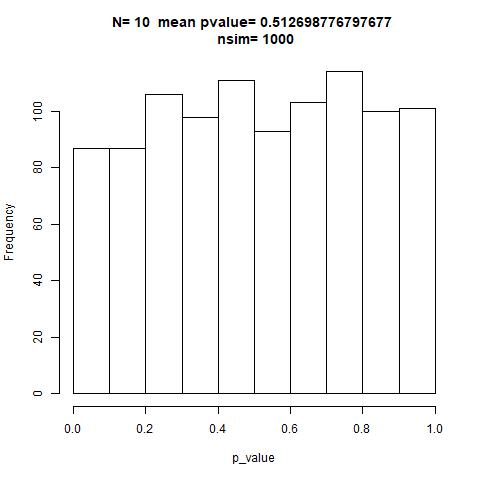
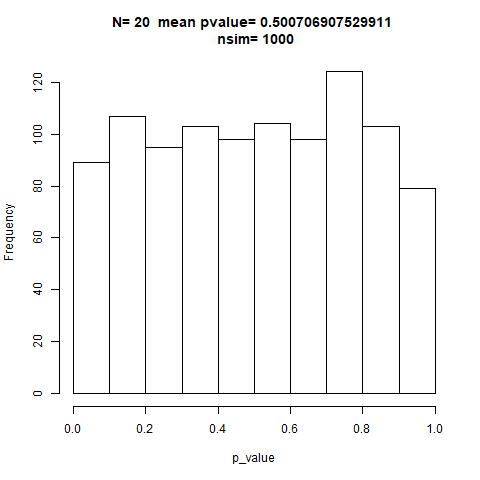
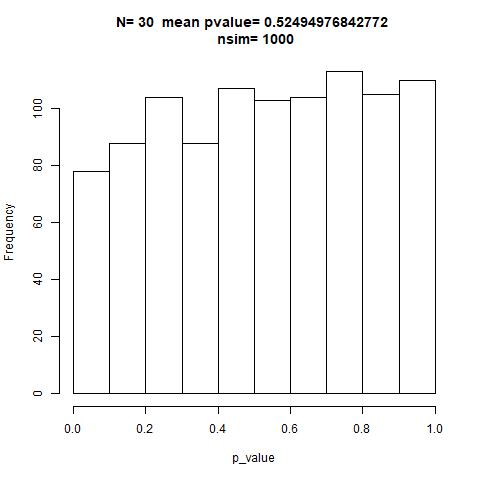
The theory suggests that P-values should follow a Uniform distribution if the null hypothesis is true.
I am testing H0: mean control= mean treatment. With 2 differents simulation methods: 1)p value distribution and 2) t.test distribution.
Histograms Method 1:
Histograms Method 2:
My question is: when I run simulations with differents n samples, I got differents distributions and differents results betwen two methods, I got opposite results about if exist signifficant differences between mean control and mean treatment.
In parallel and to proof my results I did run a 2 tail t-test betwen control and treatment to know if exist statistical differences, I got a p-value=0.0519, I dont reject H0.
What could be suggest my results?. Why i did not get a uniform distribution in method 1?. Why my results are not 100% conclusive??. Why I dont get the same results in both methods?. Most probably I am missunderstanding something...
My scripts are:
   library(downloader)
    dir <- "https://raw.githubusercontent.com/genomicsclass/dagdata/master/inst/extdata/"
    filename <- "femaleMiceWeights.csv"
    url <- paste0(dir, filename)
    fem <- read.csv(url)

    control= subset(fem, Diet=="chow", select = "Bodyweight")
    treatment= subset(fem, Diet=="hf", select = "Bodyweight")
    obs=mean(treatment$Bodyweight)-mean(control$Bodyweight)
    z= t.test(control,treatment)
    z$p.value

   "https://raw.githubusercontent.com/genomicsclass/dagdata/master/inst/extdata/femaleControlsPopulation.csv"
    filename <- "femaleControlsPopulation.csv"
    url <- paste0(dir, filename)
    pop <- read.csv(url)
    population= unlist(pop)

    set.seed(1)
    nsim_pval=1000
    for (h in seq(10, 30, 10))  {
    p_value=vector("numeric",nsim_pval)
    null=vector("numeric",1000)
        for (k in 1:nsim_pval ){
                for (i in 1:1000 ) {
                control= sample(population, h)
                treatment= sample(population, h)
                null[i] =mean(treatment)- mean(control)
                }
        p_value[k]=mean(abs(null) >= obs)*2 #p-value two tails
        ppp=mean(p_value)
        nnn=mean(null)
    }
    hist(p_value, main=paste("N=", h, "\n mean p-value=", ppp, "\n n pvalue=",nsim_pval))
    }
script for t-test distribution:
    nsim = 1000
    for (h in seq(10, 30, 10))  {
    p_value = vector("numeric",nsim)
    null = vector("numeric",nsim)
        for (i in 1:nsim) {
        control= sample(population, h)
        treatment= sample(population, h)
        z= t.test(control,treatment)
        p_value[i]=z$p.value
        pppp=mean(p_value)

        }

    hist(p_value, main=paste("N=", h, " mean pvalue=", pppp, "\n nsim=",nsim))
        }
Thanks in advance Regards

