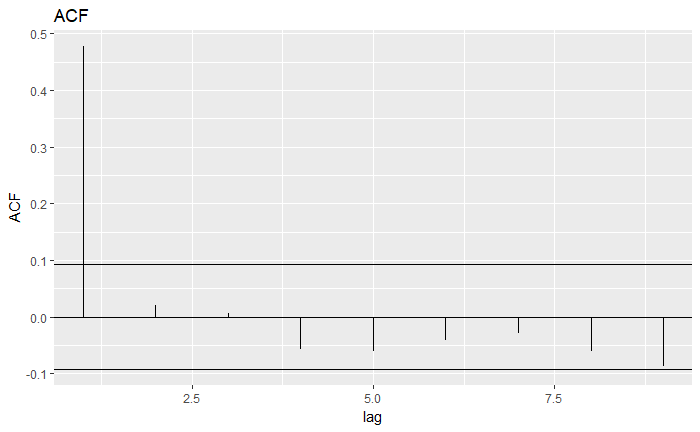
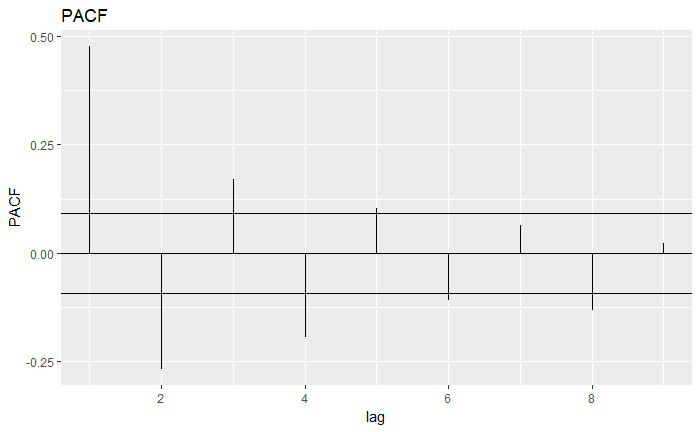
I have the following ACF and PACF plots for a time series. I'm very new to time series so I might be interpreting this wrong, but it seems like the ACF is indicating an MA(1) process because it tails off after lag 1 but the PACF looks more like an MA(3) based on the 95% CI lines. Am I interpreting one or both of these plots incorrectly?


$\begingroup$
$\endgroup$
2
-
1$\begingroup$ You're interpreting the PACF incorrectly. The PACF gives you information about the AR structure, not the MA structure. If you were going by the PACF alone, it would suggest an AR(4) model, perhaps. $\endgroup$– The LaconicCommented Aug 10, 2018 at 22:30
-
$\begingroup$ Yep, you're misreading the PACF. They look consistent to me $\endgroup$– Glen_bCommented Aug 10, 2018 at 23:19
Add a comment
|
1 Answer
$\begingroup$
$\endgroup$
ACF gives you information about moving average(MA) processes while PACF gives you insight about auto regressive (AR) processes. The graphs you have in your output can produce a consistent model. For a brief explanation (without the theory), you can look at Table 3.1 p 104 here. For more theoretic answer you can read couple of sections before the graph.
