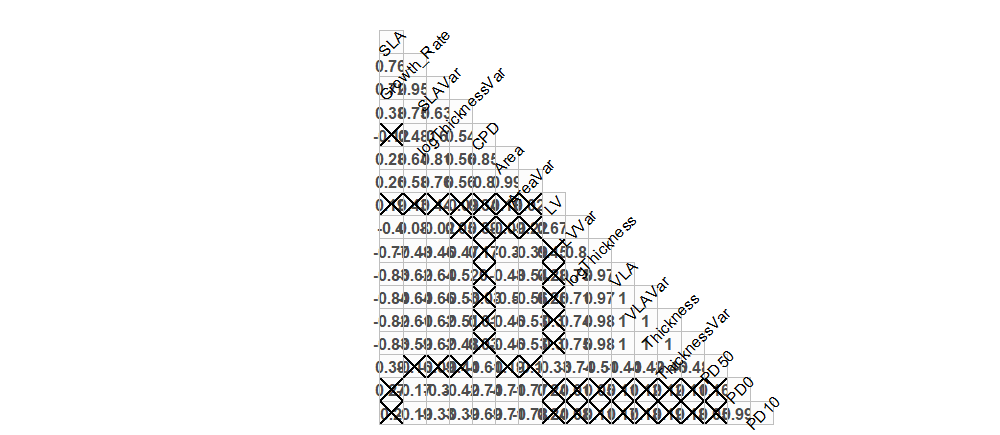
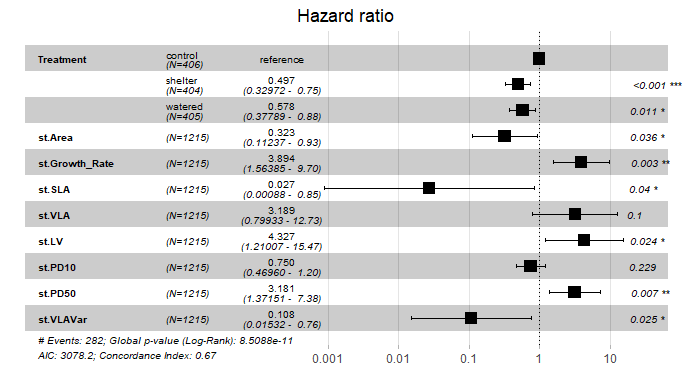
I am trying to figure out if it is possible and appropriate to use PCA to reduce the dimensions of my dataset? A little background - I have survival data with 8 covariates. I have run a Pearson's correlation test and found that the data was highly colinear.
This is what I have so far, but I am stuck on how to transform the PC axis into useable covariates for the model
otraits <- read.csv("C:/Users/bacon/Documents/Box Sync/YLR IDE Restoration Experiment/YLRmeantraitsonly.csv")
rownames(otraits) <- otraits[,1]
otraits[1:1] <- list(NULL)

MTVpca <- prcomp(otraits, center=TRUE, scale = TRUE)


pc.use <- 2 # explains 93% of variance
trunc <- MTVpca$x[,1:pc.use] %*% t(MTVpca$rotation[,1:pc.use])

#and add the center (and re-scale) back to data
if(MTVpca$scale != FALSE){
  trunc <- scale(trunc, center = FALSE , scale=1/MTVpca$scale)
}
if(MTVpca$center != FALSE){
  trunc <- scale(trunc, center = -1 * MTVpca$center, scale=FALSE)
}
dim(trunc); dim(Xt)
Specifically I want to truncate it for a cox proportional hazard model (here is an example with the original data)
cox <- coxph(Surv(Time, Event, type = c('right')) ~
               Treatment+SLA+Growth_Rate+SLAVar+AreaVar+Thickness+VLA+VLAVar+PD10+CPD,  data = YLRMeans)

ggforest(cox, data=YLRMeans)
Here is the Covariate/Trait dataset that need to PCA:
    Growth_Rate Area    AreaVar SLA SLAVar  VLA VLAVar  Thickness   ThicknessVar    logThickness    logThicknessVar LV  LVVar   PD0 PD10    PD50    CPD
ARCA    0.035049437 14.56355219 11.78670881 180.1322546 99.50427931 9.364236482 1.414207935 0.268703703 0.074128238 -1.352780779    0.298806173 43.22157529 13.35296757 12.61566    29.016  250 0.721921544
ESCA    0.029380702 1.245833333 1.076820745 262.1630059 60.49033956 4.392284625 0.596306575 0.16357684  0.038660691 -1.835819399    0.223972815 39.80718218 11.25985865 294 294 294 0.577356321
MIAU    0.00652489  0.00652489  0.011364841 3.412857143 2.976064883 151.5001201 79.68333552 2.370279914 0.731201273 0.285257143 0.120154396 37.54090305 16.93270863 183.7778    209.3333    250 0.622318052
SIBE    0.01441308  5.477777778 5.117901992 181.6818246 42.91299583 2.954769874 0.448780843 0.176855556 0.018545802 -1.735344864    0.107673785 31.80493389 4.311588188 225.2889    225.2889    315.3334    0.594958509
SIMA    0.020075948 4.974358974 4.901863202 142.4036892 39.11274955 1.651824981 0.295753475 0.148082051 0.045211395 -1.953346759    0.300665842 20.91557187 8.108682659 163.3333    193 250 0.625836637
STPU    0.01546666  5.28968254  6.055307558 122.3827137 32.67582669 7.352684101 3.027753522 0.149629537 0.031130015 -1.943799376    0.210327301 17.91978995 5.823172424 24  24  315.3334    0.611910294
Here is the head of the survival data set used for the cox model: The datafile has too many characters but I can create a cloud link with it if desired
Plot.ID Subplot Treatment   Species Time    Event   st.Growth_Rate  st.Area st.AreaVar  st.SLA  st.SLAVar   st.VLA  st.VLAVar   st.LV   st.Thickness    st.ThicknessVar st.logThickness st.logThicknessVar  st.PD0  st.PD10 st.PD50 st.CPD
PC1 1   control ACMI    829 0   2.803030572 1.085246545 1.062513537 NA  NA  NA  NA  NA  -0.21732483 -0.016144437    -0.391346353    -0.351950426    -0.735633202    -0.870395351    -0.665279262    1.429445345
PC1 2   control ACMI    829 1   2.803030572 1.085246545 1.062513537 NA  NA  NA  NA  NA  -0.21732483 -0.016144437    -0.391346353    -0.351950426    -0.735633202    -0.870395351    -0.665279262    1.429445345
PC1 3   control ACMI    829 0   2.803030572 1.085246545 1.062513537 NA  NA  NA  NA  NA  -0.21732483 -0.016144437    -0.391346353    -0.351950426    -0.735633202    -0.870395351    -0.665279262    1.429445345
PC1 4   control ACMI    829 0   2.803030572 1.085246545 1.062513537 NA  NA  NA  NA  NA  -0.21732483 -0.016144437    -0.391346353    -0.351950426    -0.735633202    -0.870395351    -0.665279262    1.429445345
PC1 5   control ACMI    829 0   2.803030572 1.085246545 1.062513537 NA  NA  NA  NA  NA  -0.21732483 -0.016144437    -0.391346353    -0.351950426    -0.735633202    -0.870395351    -0.665279262    1.429445345
PC1 6   control ACMI    829 0   2.803030572 1.085246545 1.062513537 NA  NA  NA  NA  NA  -0.21732483 -0.016144437    -0.391346353    -0.351950426    -0.735633202    -0.870395351    -0.665279262    1.429445345
PC1 7   control ACMI    829 0   2.803030572 1.085246545 1.062513537 NA  NA  NA  NA  NA  -0.21732483 -0.016144437    -0.391346353    -0.351950426    -0.735633202    -0.870395351    -0.665279262    1.429445345
PC1 8   control ACMI    829 0   2.803030572 1.085246545 1.062513537 NA  NA  NA  NA  NA  -0.21732483 -0.016144437    -0.391346353    -0.351950426    -0.735633202    -0.870395351    -0.665279262    1.429445345
PC2 1   control ACMI    829 0   2.803030572 1.085246545 1.062513537 NA  NA  NA  NA  NA  -0.21732483 -0.016144437    -0.391346353    -0.351950426    -0.735633202    -0.870395351    -0.665279262    1.429445345
PC2 2   control ACMI    829 1   2.803030572 1.085246545 1.062513537 NA  NA  NA  NA  NA  -0.21732483 -0.016144437    -0.391346353    -0.351950426    -0.735633202    -0.870395351    -0.665279262    1.429445345
PC2 3   control ACMI    535 1   2.803030572 1.085246545 1.062513537 NA  NA  NA  NA  NA  -0.21732483 -0.016144437    -0.391346353    -0.351950426    -0.735633202    -0.870395351    -0.665279262    1.429445345
PC2 4   control ACMI    535 1   2.803030572 1.085246545 1.062513537 NA  NA  NA  NA  NA  -0.21732483 -0.016144437    -0.391346353    -0.351950426    -0.735633202    -0.870395351    -0.665279262    1.429445345
PC2 5   control ACMI    535 1   2.803030572 1.085246545 1.062513537 NA  NA  NA  NA  NA  -0.21732483 -0.016144437    -0.391346353    -0.351950426    -0.735633202    -0.870395351    -0.665279262    1.429445345
PC2 6   control ACMI    829 0   2.803030572 1.085246545 1.062513537 NA  NA  NA  NA  NA  -0.21732483 -0.016144437    -0.391346353    -0.351950426    -0.735633202    -0.870395351    -0.665279262    1.429445345


