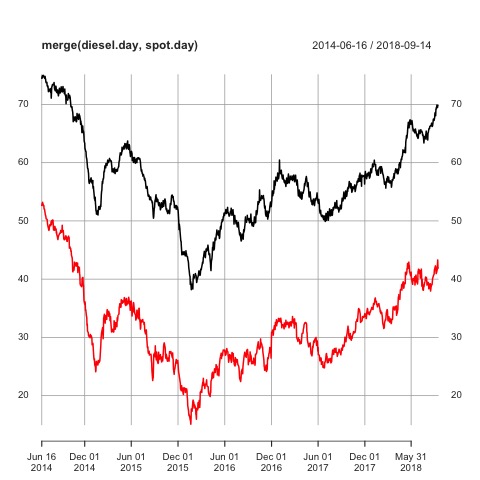
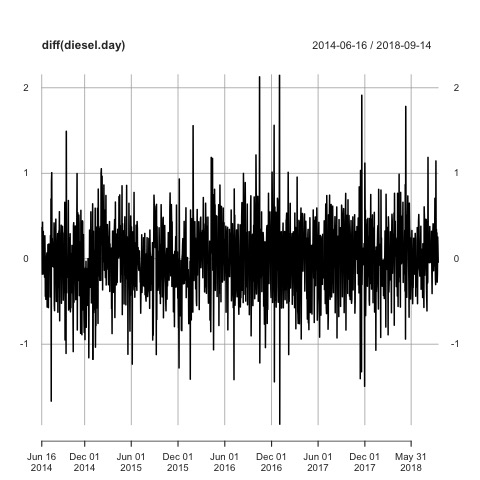
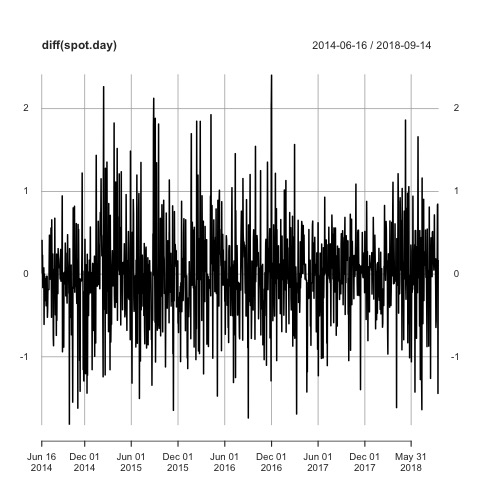
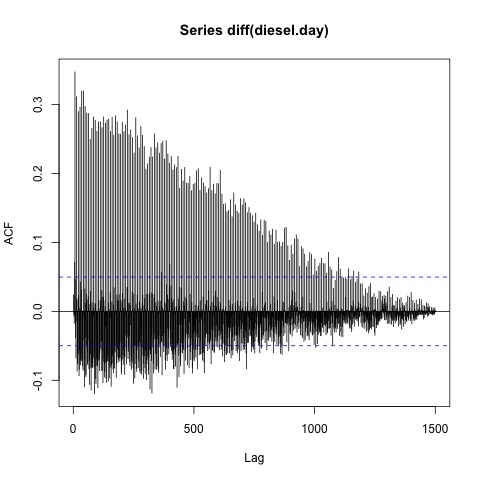
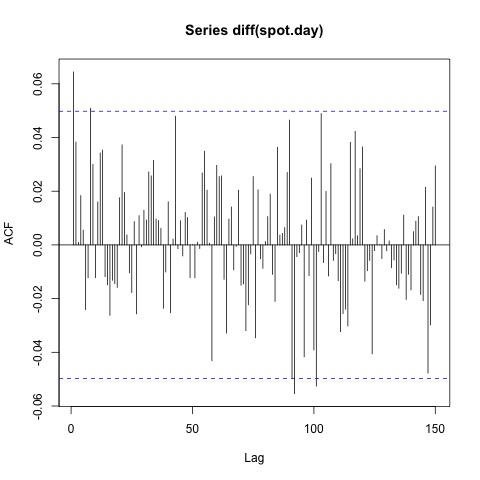
I have two time series of daily gasoline prices (1500 observations each) which I suspect to be cointegrated. I aim to find an ECM/Asymmetric ECM/Threshold ECM to investigate possible asymmetries. My problem is that one of the time series has a weekly seasonal pattern which can be seen from the ACF of the first difference (Picture at the end). There are a lot of papers in which possible cointegration relationships between gasoline and other prices are studied. Unfortunately, there is not a single one in which seasonality is mentioned. Therefore I have two questions.
How can I determine the type of seasonality? For weekly data both, "deterministic" as well as "stochastic" seasonality seems to be reasonable.
How do I deal with the seasonality in the context of ECM's? For example, when applying the ADF-Test ("ur.df" from urca-package) to the first difference, the "BIC" selects 21 lags, but only the lags 7, 14, 21 (and three other lags) are significant. Since the lags in the ADF are designed to capture autocorrelation, it seems sensible to only add multiples of 7 as lags. But it would be great to have a reference to cite.
Is it feasible to include a dummy variable for the weekday or should I use seasonally adjusted data to estimate the ECM? Otherwise, I expect the estimated ECM's to be biased since price changes are not caused by disequilibrium but by the weekday.
I couldn't find a paper or book in which the combination of cointegration and seasonality in one of the series is handled.
Of course I know the "Hylleberg-Engle-Granger-Yoo" paper, but they is about seasonal cointegration.

