3
$\begingroup$

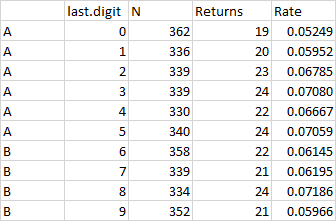
Suppose I have the return information for two reverse logistic companies--See example data. For certain groups companies A and B each receive 50% of the work from a client, but for another group company A receives 60% of the work and company B receives 40% of the work. They are assigned work from clients based on the last digit of an account number and are told it is random.

Example Data

Initial Comparison

  1. Is there any way to find out that the account numbers are really randomly assigned?
  2. How would I prove/disprove to someone if one company is actually doing better than another company or if it is probably random chance that one company's rate of return is ever so slightly better than the other company's? My initial thoughts are a t-test or chi-squared test, but in some groups the data isn't evenly divided between the two companies and the data isn't normally distributed. EDIT: In samples of the data the amount of work isn't evenly divided between the two companies and the rate of return isn't normally distributed.
$\endgroup$

3 Answers 3

3
+50
$\begingroup$
  1. On testing performance of two group

Since, task is assigned randomly to each of the company, and normality is suspicious, therefore, I would recommend you to use non-parametric test to compare the performance of the group. One option is Mann Whitney Test. Unlike the t-test it does not require the assumption of normal distributions. It is nearly as efficient as the t-test on normal distributions.

  1. Is there any way to find out that the account numbers are really randomly assigned?

For this, start with plotting (You can use this for part 1 too). Make a line chart, or frequency distribution. If you find any strong pattern in the plot (like 70% of the numbers less than 5 are assigned to company A etc), then you can infer that tasks are not assign randomly to both the company (provided sample size is large enough). Otherwise, you can use Run Test to test the hypothesis. Again Run test is non-parametric test, therefore, it does not make any assumption about the distribution of the data.

$\endgroup$
4
  • $\begingroup$ If I run a M-W using R and the (using wilcox.test(Rate ~ Company, data = dat, exact = FALSE, alternative ="greater", conf.int = T, conf.level = 0.95). The data is organized BBBBBBAAAABBBBBBAAAA etc. is this making the alternative hypothesis that B>A or that A>B? $\endgroup$
    – Amanda R.
    Commented Nov 19, 2018 at 21:48
  • $\begingroup$ Also, what if we know that the work is divided between the companies by the last digit of the account number. Is there any way to prove that the last digit of the account is a random number? $\endgroup$
    – Amanda R.
    Commented Nov 19, 2018 at 22:51
  • $\begingroup$ @AmandaR. For first comment, I would recommend you read R help file. For second one, you can use Run Test. $\endgroup$
    – Neeraj
    Commented Nov 20, 2018 at 6:48
  • $\begingroup$ I've looked at the R help file already. $\endgroup$
    – Amanda R.
    Commented Nov 20, 2018 at 15:35
1
$\begingroup$

Welch's T test can control for uneven groups, and if you have large enough samples then central limit theorem applies so no need to worry if the original data i normal or not.

EDIT: sigh, you try to help people and get thumbed down for it. Central limit theorem isn't just some 'theory', it's one of the most fundamental theories in stats. It says that for any distribution with variance less than infinity, the distribution of sample means will be normally distributed. That's why you can use a T test on it, because a T test tests sample means against other sample means. The original distribution drops away. But CLT requires large samples to converge--larger for more non normal distributions, but usually only around 30+. The T test is robust with large sample sizes. But feel free to use other non parametric tests, but they tend to pay a price in power by having fewer assumptions. The other suggestion of the Mann Whitney U is fine if you want to go with that; I was just suggesting a simple familiar test.

$\endgroup$
6
  • $\begingroup$ Since the data N is 300+ for the last digit for each account and therefore N is 1000+ for each company the sample is considered large enough correct? $\endgroup$
    – Amanda R.
    Commented Nov 16, 2018 at 18:09
  • $\begingroup$ Also to run a t test would I need to change the data so it is a list of each account and Rate is 1 if it was returned and 0 if it wasn't? $\endgroup$
    – Amanda R.
    Commented Nov 16, 2018 at 18:20
  • $\begingroup$ 300+ is more than enough. No your rate of return appears to be what percentage of potential sales did they close or something like that. So just sum them up as you a;ready have and you have a mean for each company, and the formulas are there whichever one you go with. Unless by returns you mean goods were returned? $\endgroup$
    – Huy Pham
    Commented Nov 19, 2018 at 13:17
  • $\begingroup$ Yes, by rate of return I mean proportion of goods that were return. (I know that is not the best way to describe it, but that is the term I was given.) $\endgroup$
    – Amanda R.
    Commented Nov 19, 2018 at 15:23
  • $\begingroup$ I'm not sure why you think you have to go back and relabel your rate. Your unit of observation is simply each account has a return rate. A has n accounts with n return rates. You want to compare that to B with slightly fewer number of observations. That's ok; that's why I linked the Welch t test. You can just mean them and see if the difference is significant. $\endgroup$
    – Huy Pham
    Commented Nov 19, 2018 at 16:15
1
$\begingroup$

Is there any way to find out that the account numbers are really randomly assigned?

I believe you can use tests available in this link, here are four tests that you can do on frequency counts.

Now for this question-

How would I prove/disprove to someone if one company is actually doing better than another company or if it is probably random chance that one company's rate of return is ever so slightly better than the other company's? In samples of the data the amount of work isn't evenly divided between the two companies

Use t test on mean rate of return between two companies which has lesser rate of return is doing good, If the amount not evenly distributed it doesn't matter, and the problem with normal distribution of rate of return use transformations here is an outstanding blog on how to transform data to normal distribution.

Please comment if you have any doubts or i didn't met the question properly. Thanks!

$\endgroup$
1
  • $\begingroup$ See edit made to question for clarification $\endgroup$
    – Amanda R.
    Commented Nov 19, 2018 at 15:29

Your Answer

By clicking “Post Your Answer”, you agree to our terms of service and acknowledge you have read our privacy policy.

Not the answer you're looking for? Browse other questions tagged or ask your own question.