11
$\begingroup$

I want to visualize the results of a clustering (produced with protoclust{protoclust}) by creating scater plots for each pair of variables used for classifying my data, colouring by classes and overlapping the ellipses for the 95% confidence interval for each of the classes (to inspect which elipses-classes overlap under each pair of variables).

I have implemented the drawing of the ellipses in two different ways and the resulting ellipses are different! (bigger ellipses for first implementation!) A priori they differ only in size (some diferent scaling?), as the centers and angle of axes, seem to be the similar in both. I guess I must be doing something wrong by using one of them (hope not with both!), or with the arguments.

Can anyone tell me what I am doing wrong?

Here the code for the two implementations; both are based on the answers to How can a data ellipse be superimposed on a ggplot2 scatterplot?

### 1st implementation 
### using ellipse{ellipse}
library(ellipse)
library(ggplot2) 
library(RColorBrewer)
colorpal <- brewer.pal(10, "Paired")

x <- data$x
y <- data$y
group <- data$group
df <- data.frame(x=x, y=y, group=factor(group))

df_ell <- data.frame() 
for(g in levels(df$group)){df_ell <- rbind(df_ell, cbind(as.data.frame(with(df[df$group==g,], ellipse(cor(x, y),scale=c(sd(x),sd(y)),centre=c(mean(x),mean(y))))),group=g))} 

p1 <- ggplot(data=df, aes(x=x, y=y,colour=group)) + geom_point() + 
  geom_path(data=df_ell, aes(x=x, y=y,colour=group))+scale_colour_manual(values=colorpal)

### 2nd implementation 
###using function ellipse_stat() 
###code by Josef Fruehwald available in: https://github.com/JoFrhwld/FAAV/blob/master/r/stat-ellipse.R

p2 <-qplot(data=df, x=x,y=y,colour=group)+stat_ellipse(level=0.95)+scale_colour_manual(values=colorpal)

Here is the two plots together (left graph is p1 implementation (ellipse()):
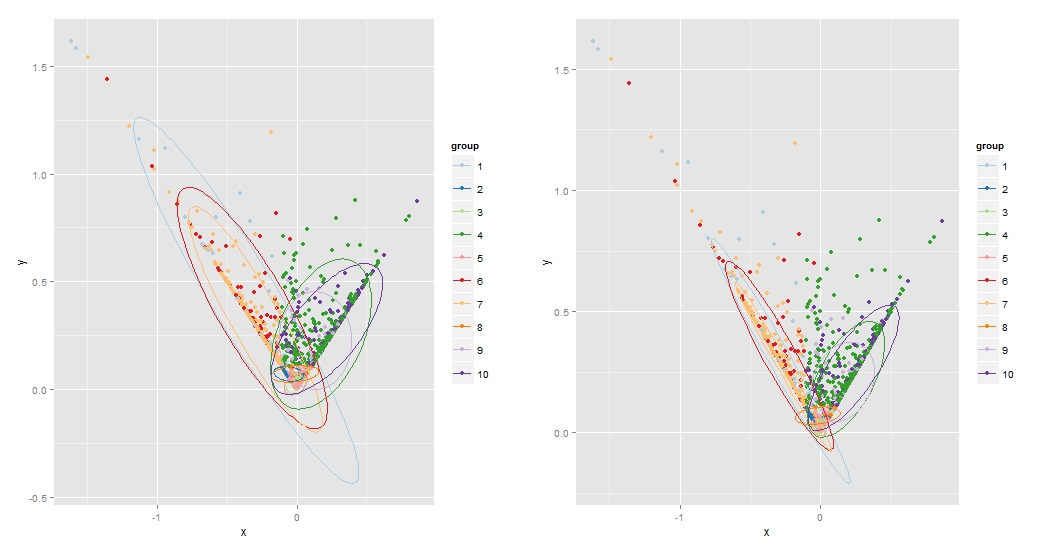
enter image description here

The data are available here: https://www.dropbox.com/sh/xa8xrisa4sfxyj0/l5zaGQmXJt

$\endgroup$
2
  • $\begingroup$ This might not matter, but when I run your code I get a warning Warning message: In cov.trob(cbind(data$x, data$y)) : Probable convergence failure is this also happening when you run the code? $\endgroup$
    – atiretoo
    Commented Oct 2, 2012 at 18:39
  • $\begingroup$ @atiretoo Yes, it also happens when i run the code. I dont know why. Maybe anyone else knows? jose $\endgroup$
    – josetanago
    Commented Oct 3, 2012 at 7:37

1 Answer 1

9
$\begingroup$

You're not doing anything wrong, the two functions are making different underlying assumptions about the distribution of the data. Your first implementation is assuming multivariate normal, and the 2nd a multivariate t-distribution (see ?cov.trob in package MASS). The effect is easier to see if you pull out one group:

#pull out group 1
pick = group ==1
p3 <- qplot(data=df[pick,], x=x, y=y)
tl = with(df[pick,], 
     ellipse(cor(x, y),scale=c(sd(x),sd(y)),
             centre=c(mean(x),mean(y))))
p3 <- p3 + geom_path(data=as.data.frame(tl), aes(x=x, y=y))
p3 <- p3 + stat_ellipse(level=0.95)
p3 # looks off center
p3 <- p3 + geom_point(aes(x=mean(x),y=mean(y),size=2,color="red"))
p3

So although it is close to the same center and orientation they are not the same. You can come close to the same size ellipse by using cov.trob() to get the correlation and scale for passing to ellipse(), and using the t argument to set the scaling equal to an f-distribution as stat_ellipse() does.

tcv = cov.trob(data[pick,2:3],cor=TRUE)
tl = with(df[pick,], 
          ellipse(tcv$cor[2,1],scale=sqrt(diag(tcv$cov)),
                  t=qf(0.95,2,length(x)-1),
                  centre=tcv$center))
p3 <- p3 + geom_path(data=as.data.frame(tl), aes(x=x, y=y,color="red"))
p3

but the correspondence still isn't exact. The difference must be arising between using the cholesky decomposition of the covariance matrix and creating the scaling from the correlation and the standard deviations. I'm not enough of a mathematician to see exactly where the difference is.

Which one is correct? That's up to you to decide! The stat_ellipse() implementation will be less sensitive to outlying points, while the first will be more conservative.

$\endgroup$
2
  • 1
    $\begingroup$ Thanks a lot for taking your time solving this question! Its clear to mee now. jose $\endgroup$
    – josetanago
    Commented Oct 3, 2012 at 7:29
  • 1
    $\begingroup$ I like ellipses in plots, so this was fun to see these functions in action. $\endgroup$
    – atiretoo
    Commented Oct 3, 2012 at 17:54

Your Answer

By clicking “Post Your Answer”, you agree to our terms of service and acknowledge you have read our privacy policy.

Not the answer you're looking for? Browse other questions tagged or ask your own question.