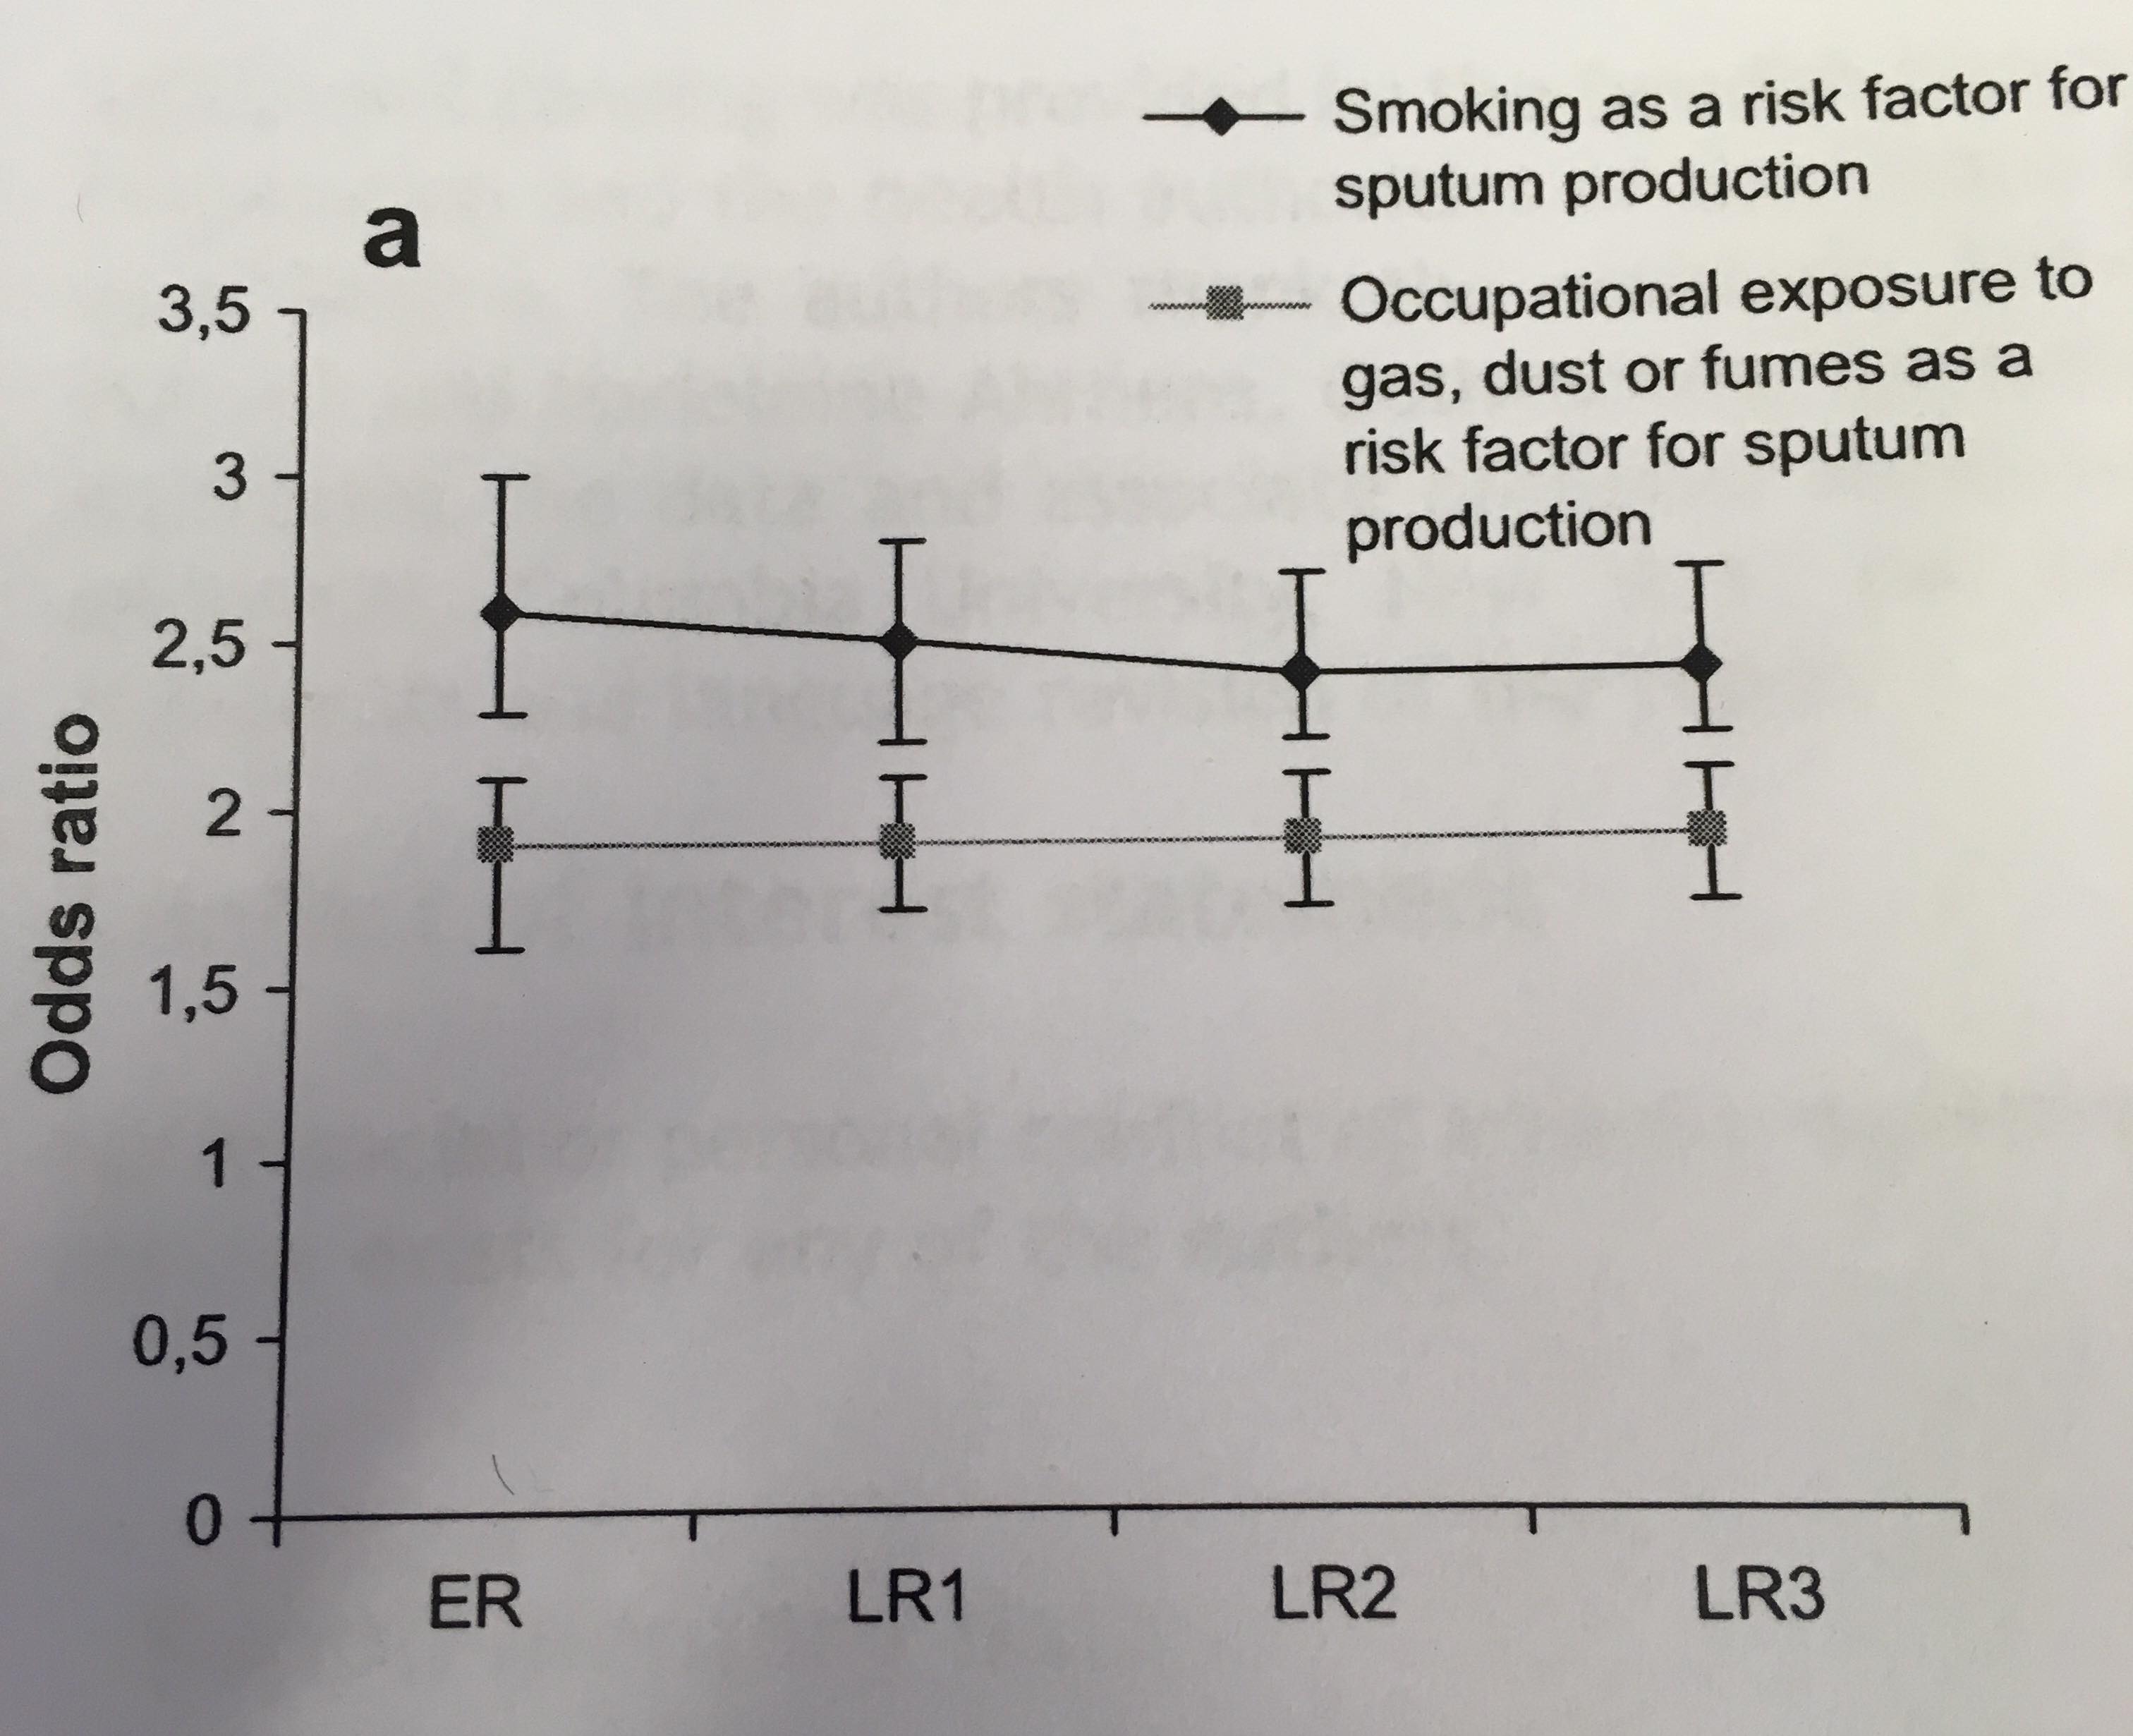
I am currently working on a project that evaluates certain study recruitment strategies in regards of increasing participation among different subgroups.
One of those strategies is reminder letters. If a potential participant does not respond to the invitation letter, a reminder letter is sent, if they still do not respond, another one is sent, etc., up to 3 reminder letters (then the person is considered a nonresponder).
To evaluate this strategy, I want to see if the participants that joined after, say, the second reminder letter made an impact on our data. In other words, were they worth that effort, considering they were not a lot to begin with (but their characteristics were very different according to a chi-squared test)?
So I want to graph the change in the odds ratio (with 95% CI) of certain variables (like age for example) from no reminder letters (0), after one reminder letter (0+1), after 2 reminder letters (0+1+2), and after 3 (0+1+2+3).
Edit: My way of doing this would be to set the outcome as 0 for people that joined after reminders, and 1 for people that joined after the invitation letter only, do a logistic regression and calculate odds ratio for all variables.
Then I would set 0 for people joining after 2nd and 3rd reminder letters, and 1 for those that joined after Invitation letter and 1 st reminder, and again measure odds ratio for all variables. Then again I would set 0 for people that joined after 3rd reminder, and 1 for those who joined after invitation letter + 1st letter + 2nd letter, etc.
In the end I would, for example, graph the odds ratio for all those regressions for age and sex (male), and so we can see if the relationship changed in anyway because of the reminder letters.
What I am asking is if there is a simpler way I could do all this.

