-1
$\begingroup$

I am trying to do a simple k-means clustering to my dataset. The result I get it the one that can be seen below:enter image description here
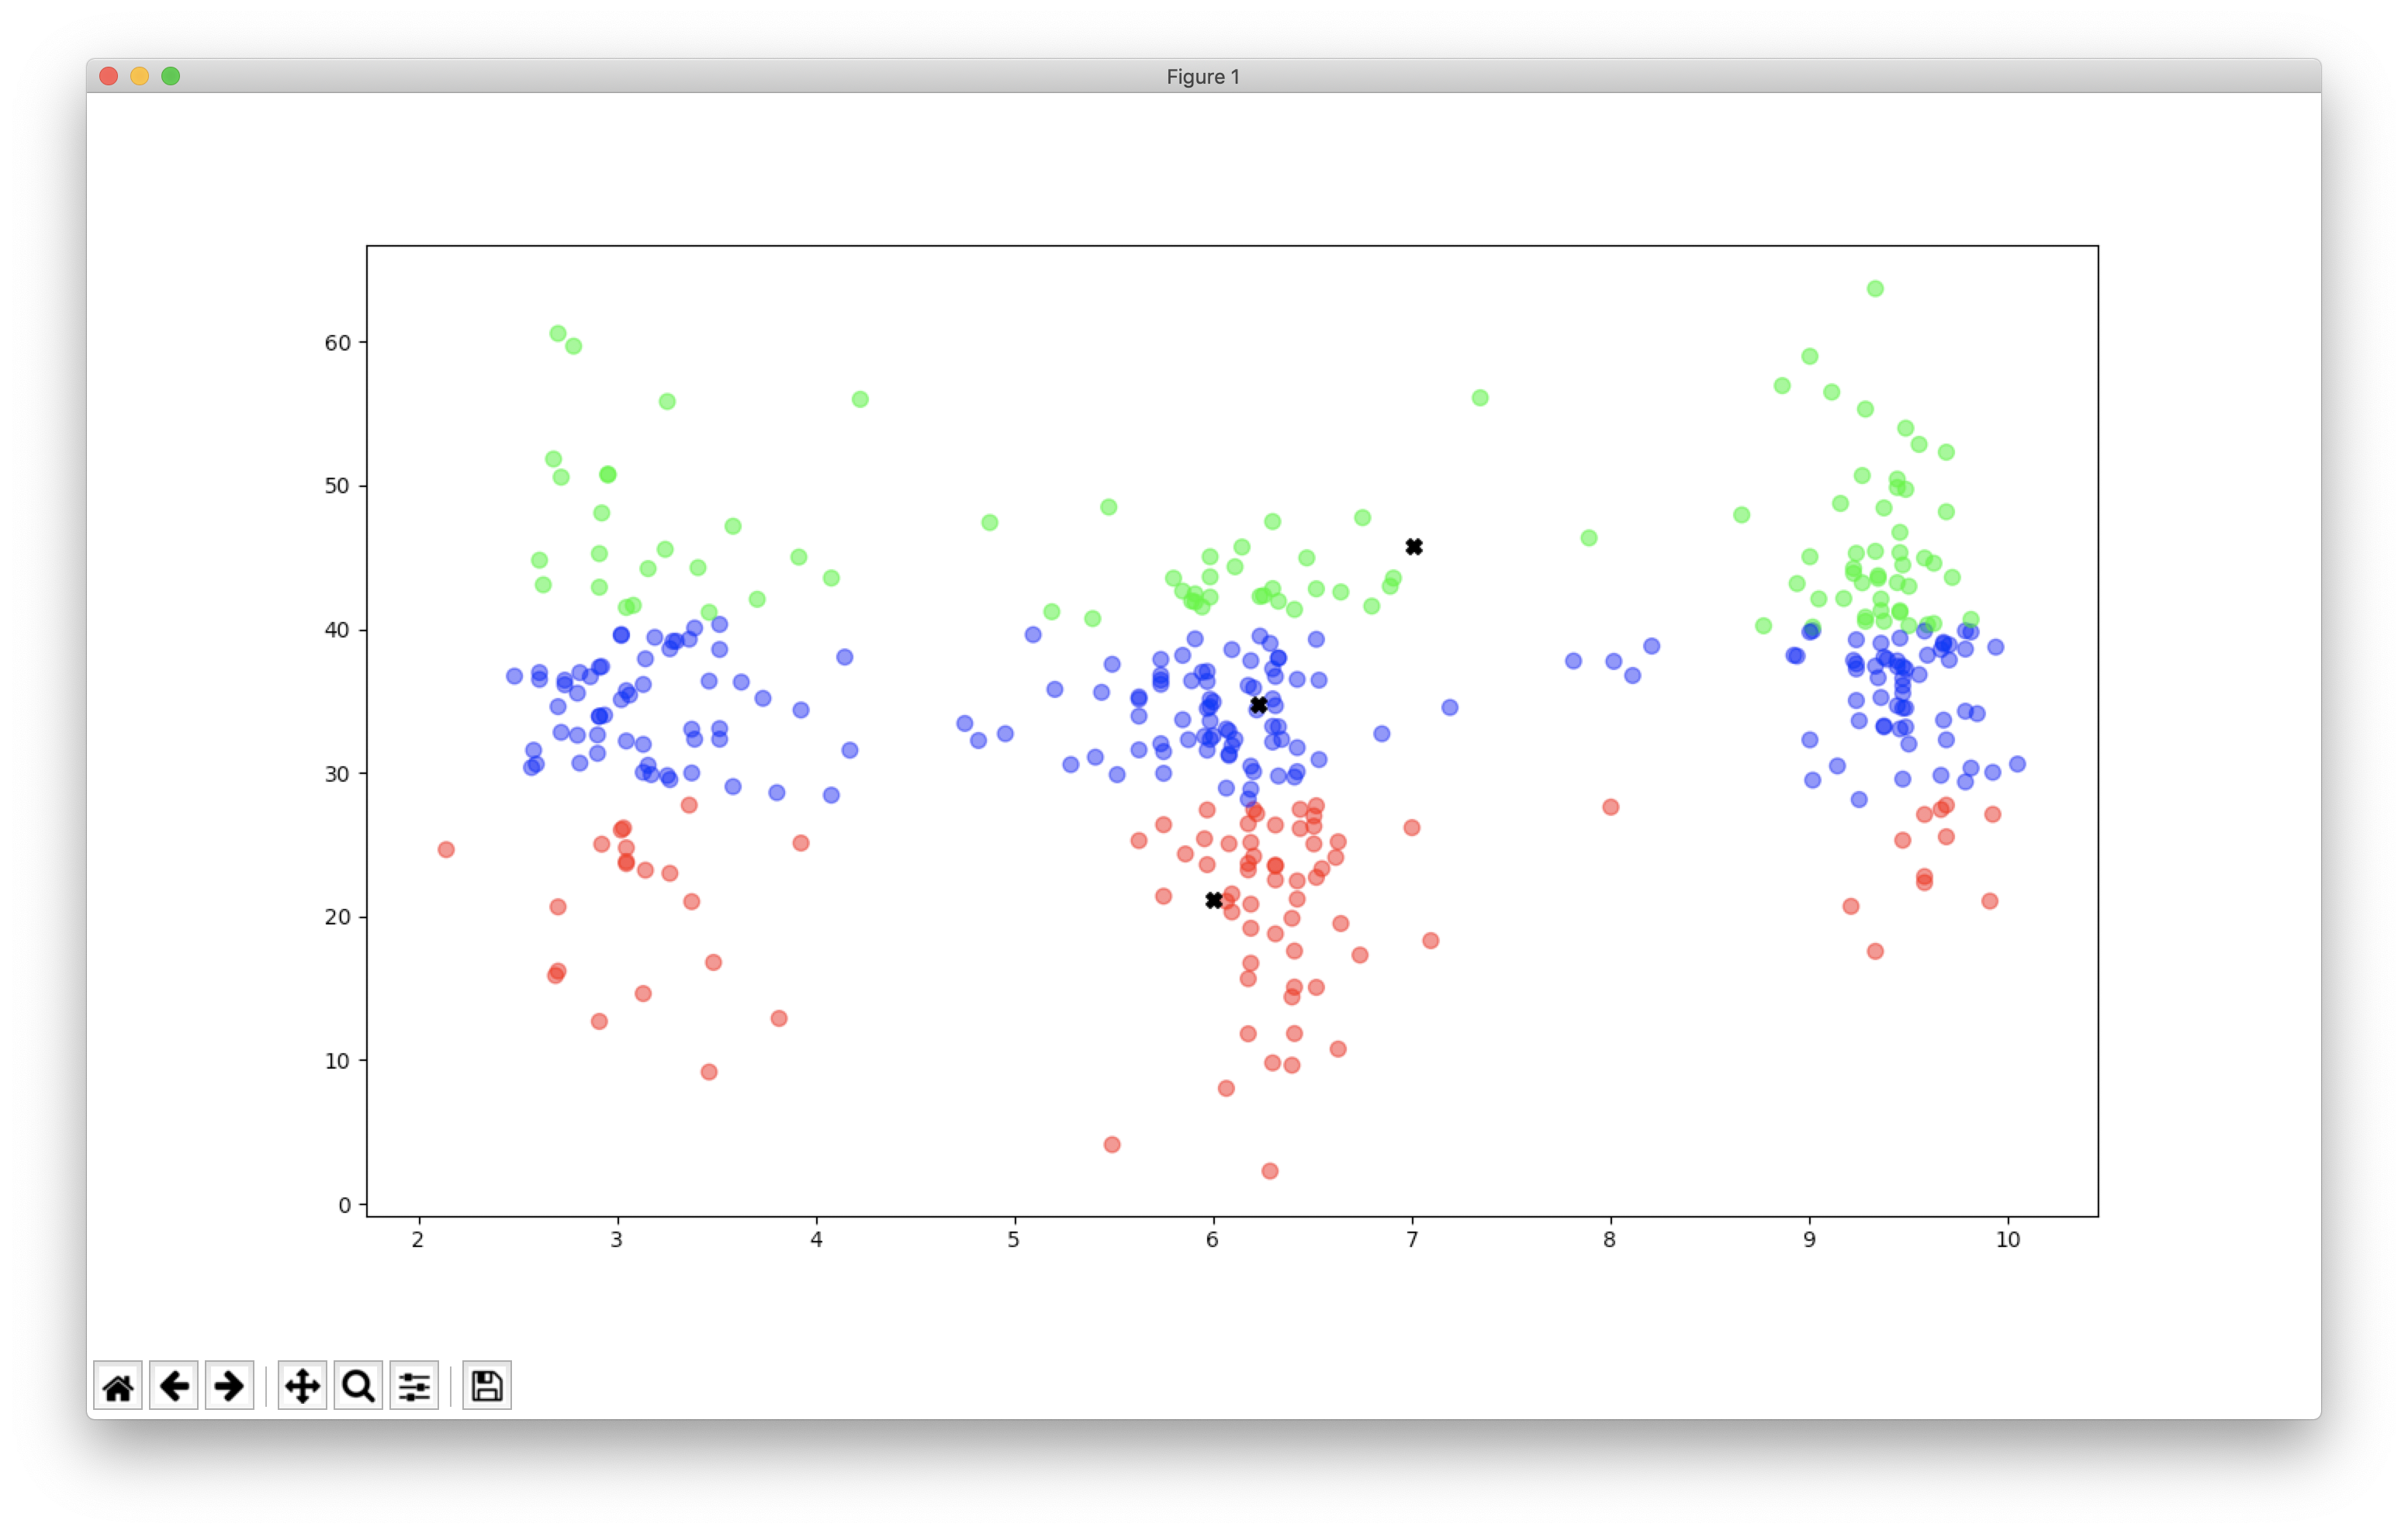
However, the result I would like to have, as it corresponds to geographical areas, looks something like this: enter image description here
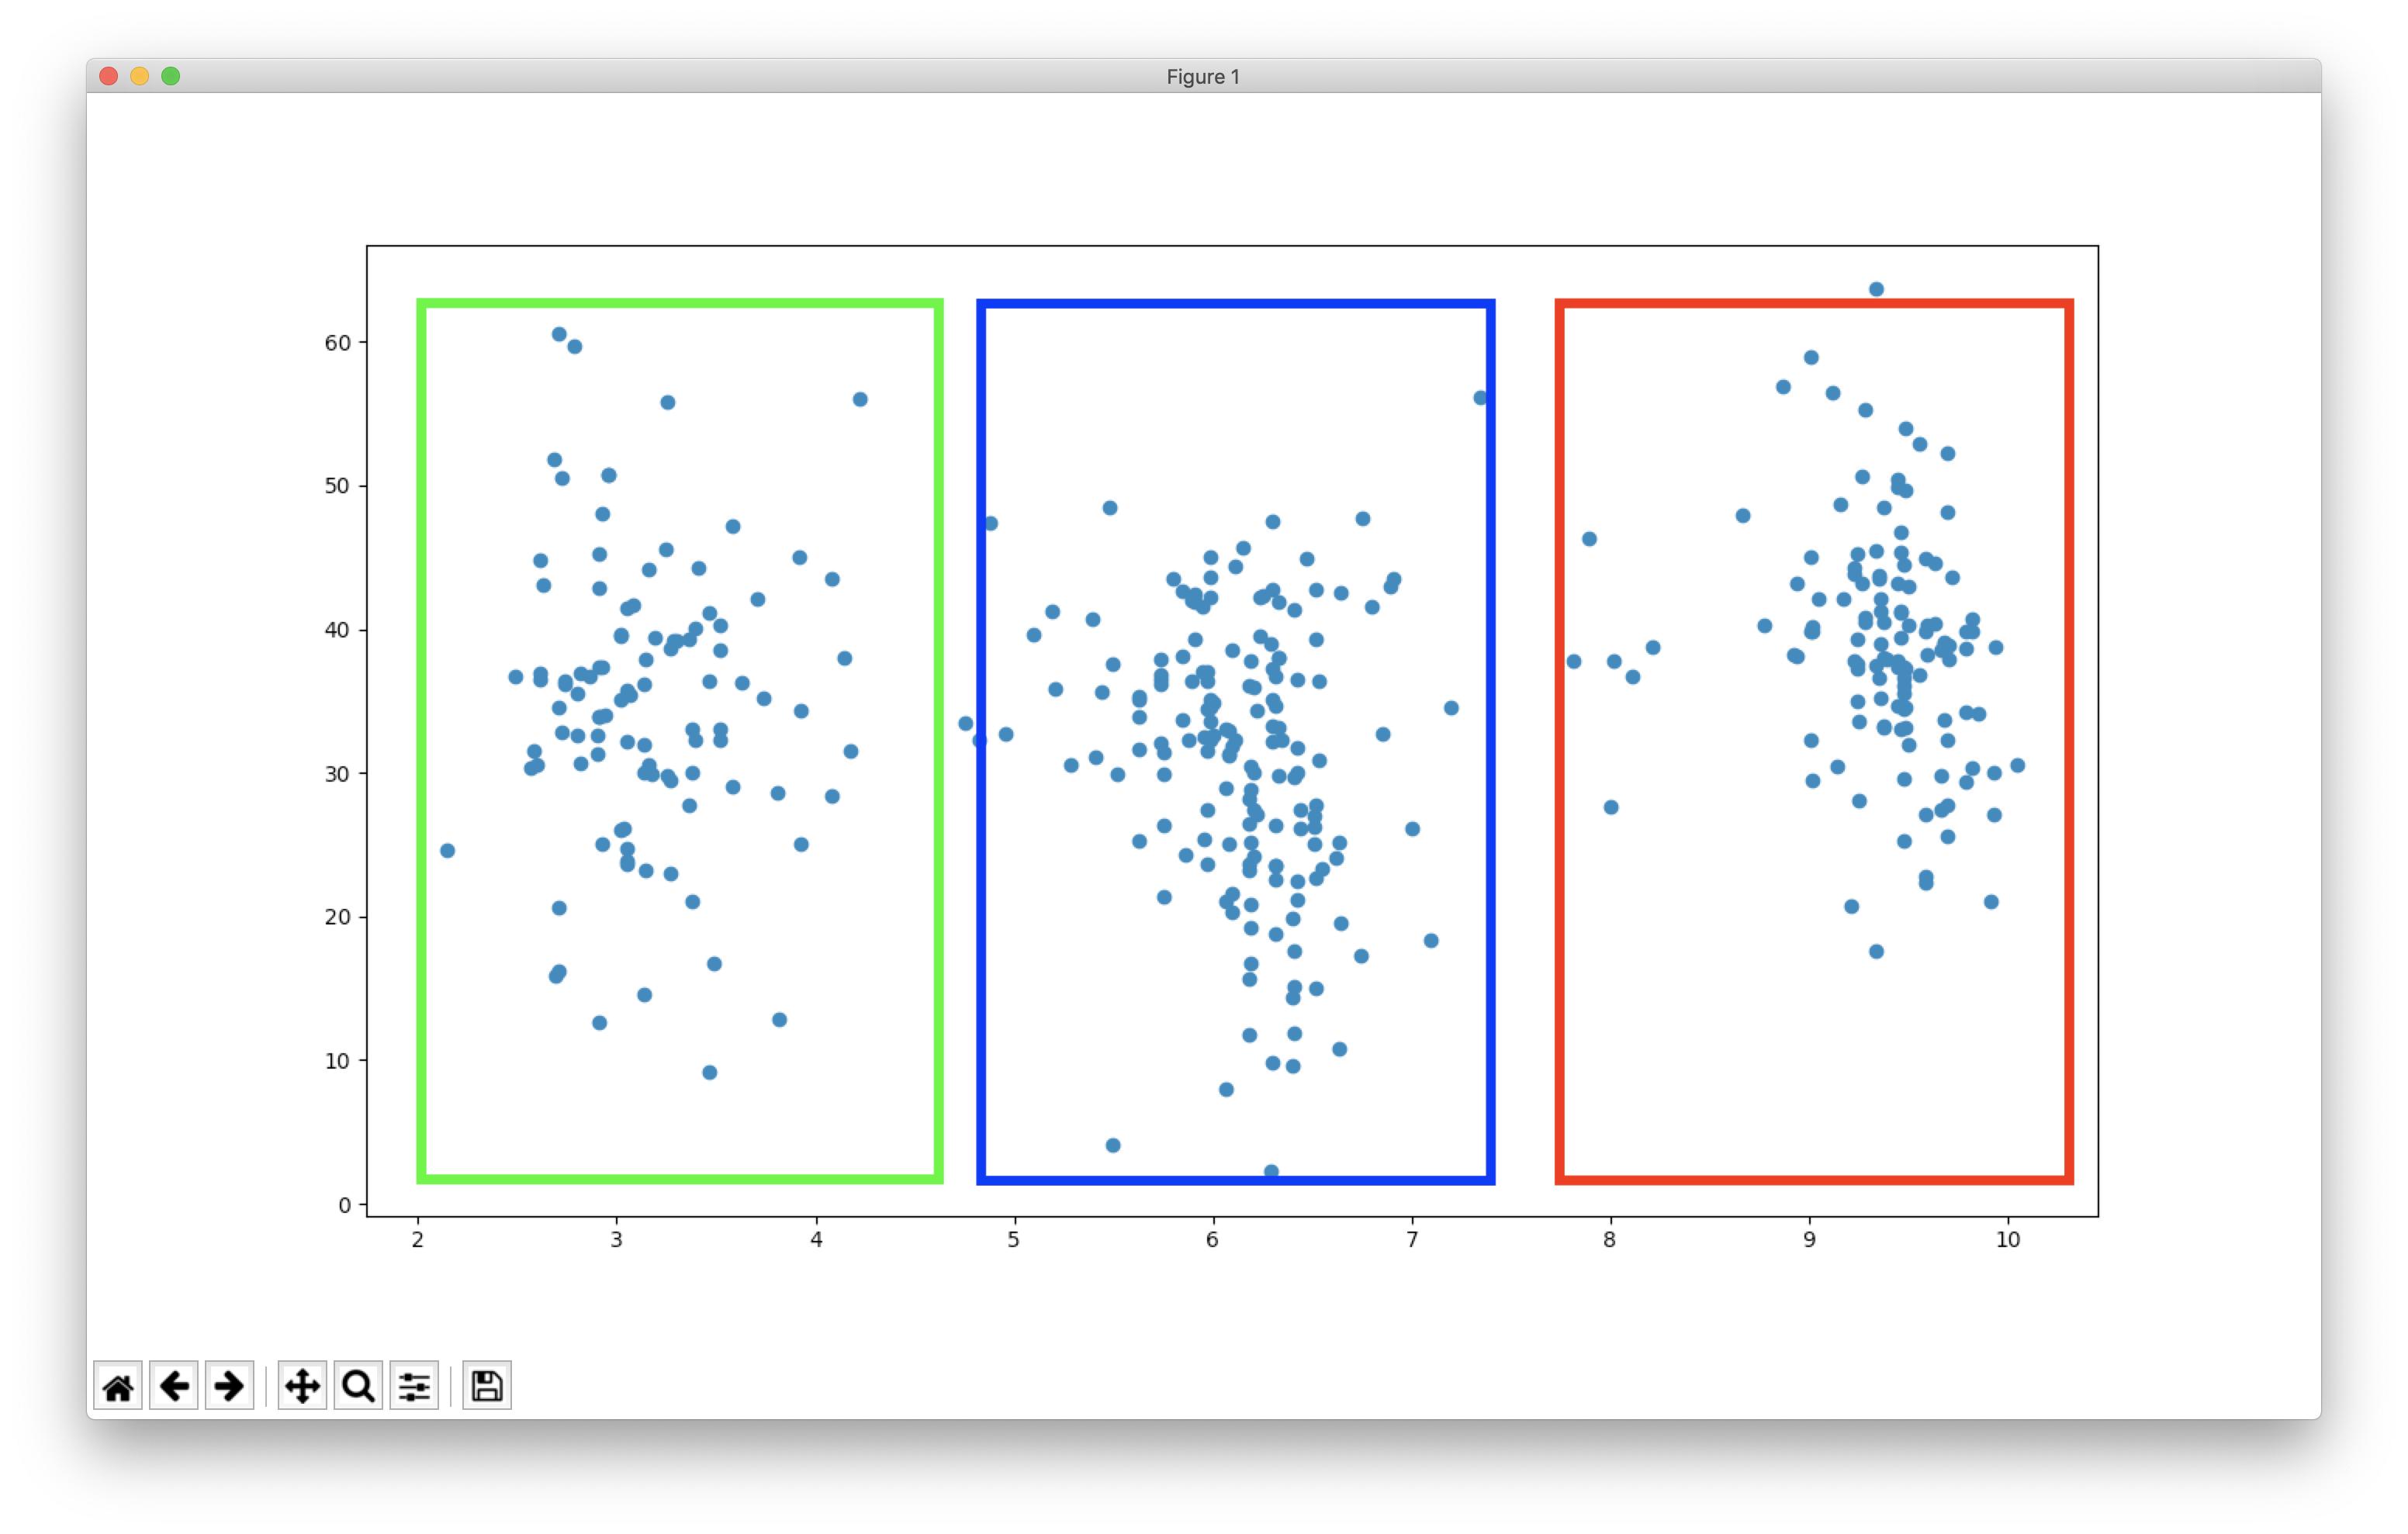
Is there a proper way to to give weight to x axis values or limitations regarding the euclidean distance between the centroids? For example, adding some restrictions regarding the result (the euclidean distance between the two points of the same cluster should not be larger than X).

Or even a different method than k-means? My latest efforts with GMM seem to do a better job, although some 'manual' interventions (the restrictions regarding the euclidean distance) have been included.

$\endgroup$
6
  • 1
    $\begingroup$ You have applied a massive horizontal exaggeration to get that graph. If you change the aspect ratio to respect the units you are showing, then the k-means solutions won't look so dopey. Otherwise, if you know what makes sense just from a plot of the data you don't need a fancy method to subdivide your space. For just about 200 years scientists sometimes found clusters on scatter plots by using eye and brain: has k-means, smart that it is, ever found clusters that weren't evident otherwise? $\endgroup$
    – Nick Cox
    Commented Apr 17, 2019 at 15:50
  • $\begingroup$ @NickCox this is just an example using (maybe) not correct sample data. I am interested in the alternative methodologies and not the specific example itself. $\endgroup$
    – manosbar
    Commented Apr 17, 2019 at 19:22
  • $\begingroup$ We don't know that unless you tell us. The question really seems to imply that these are data you care about. If not, please rewrite the question and ask more clearly what you really want to know. $\endgroup$
    – Nick Cox
    Commented Apr 17, 2019 at 19:32
  • $\begingroup$ In addition to what @NickCox said (+1 to Nick) you should label the x and y axes. You should also explain what you mean by "guided". And "unsupervised" doesn't mean what you seem to think it means. It just means that there is no pre-assigned grouping. $\endgroup$
    – Peter Flom
    Commented Apr 18, 2019 at 12:09
  • $\begingroup$ @NickCox and Peter, I have edited the question in order to better explain what I am trying to do. If this is still not the case, feel free to delete the question. Thank you for your interest and time invested. $\endgroup$
    – manosbar
    Commented Apr 18, 2019 at 16:17

2 Answers 2

3
$\begingroup$

Your intuition is not objective.

You are being misled by a bad plot. Your data actually looks more like this:

Are you still convinced your "intuitive" solution is better? Split your data with a threshold on the x axis, and compute the cost function.

Just kidding. Normalize your data and this toy example will work.

If you intend to incorporate user feedback, metric learning may be worth looking into. If you learn a linear transformation, you can run k-means on the scaled data. Have a user select instances from the same and from different clusters to learn the projection.

$\endgroup$
3
  • $\begingroup$ thank you for your answer. As also replied to another comment this is just an example using (maybe) not correct sample data. I am interested in the alternative methodologies and not the specific example itself $\endgroup$
    – manosbar
    Commented Apr 17, 2019 at 19:24
  • $\begingroup$ Did you read the last paragraph of the answer? $\endgroup$ Commented Apr 18, 2019 at 6:02
  • $\begingroup$ of course, and this why I thanked you. I will check the following days and let you know if that works better for my case studies! $\endgroup$
    – manosbar
    Commented Apr 18, 2019 at 10:05
2
$\begingroup$

Possibility 1: k-means is somewhat sensitive to the choice of the initial cluster centers. It's usually a good idea to re-run it multiple times with different (e.g., randomly generated) initial centers, and to pick the clustering that optimizes, e.g., the silhouette score.

Possibility 2: your data looks like a density-based clustering would give you results more to your liking. I suggest you look into DBSCAN, or its hierarchical version HDBSCAN.

Also, How to understand the drawbacks of K-means may be useful.

$\endgroup$
2
  • 1
    $\begingroup$ Why was this downvoted? If there's a good reason, please comment and say what is wrong or lacking. I reversed the downvote. $\endgroup$
    – Nick Cox
    Commented Apr 17, 2019 at 18:04
  • $\begingroup$ Neither 1 nor 2 helps here. Rerunning must find similar solutions, and DBSCAN and HDBSCAN also won't work. Because of the scaling. $\endgroup$ Commented Apr 18, 2019 at 6:00

Not the answer you're looking for? Browse other questions tagged or ask your own question.