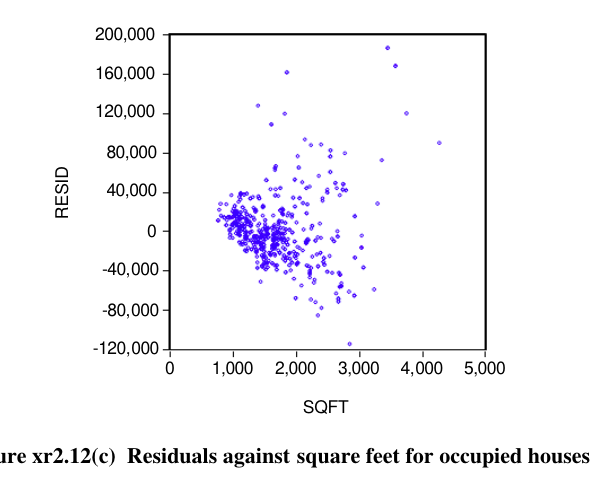
In this residual plot, both the increase and the decrease in the y variables are observed. In this case, how do you conclude whether heteroscedasticity exist or not? I am not sure if I can just simply conclude that overall the value of y variable increases as the value for x variable increases. In this case, do you assume no conclusion can be drawn ?
-
1$\begingroup$ You don't say what these are residuals from: I guess plain or vanilla regression in which price or value of property is the response.. The "y variable" is the residual. Putting a guide line on the graph at residual = 0 is often a good idea. Here although formal tests might appeal to some, informal examination would be enough for me: this is strong heteroscedasticity. The nature of your predictor and how it behaves in many analyses (a measure of area) suggests working with log area as well as using a generalised linear model with log link for price or value. $\endgroup$– Nick CoxCommented Apr 20, 2019 at 7:05
3 Answers
I would split the data set with respect to SQFT into - let's say - 10 intervals. Then I would compute the variance of RESID in each interval, and you will see that the variance varies substantially.
edited after proposition by Nick Cox
When you look at residuals judgement is inherently involved. You can try the White's test for heteroscedasticity if you want a formal test (but it tests simultaneously for a misspecified model so you can not be sure what causes the results unless you are sure your model is not misspecified). You could also try one of the transformations or methods recommended with heteroscedasticity and see if the problem goes away when you transform the data... I suggest using White standard errors if nothing else because you might have hetero....


