5
$\begingroup$

Consider this question,

Suppose $X_1, X_2, . . . , X_n$ is a random sample from an exponential distribution with mean $\lambda$. Assume that the observed data is available on $[X_1], . . . , [X_n]$, instead of $X_1, . . . , X_n$, where $[x]$ denotes the largest integer less than or equal to $x$. Consider a test for $H_0 : \lambda = 1$ vs $H_1 : \lambda > 1$ which rejects $H_0$ when $\displaystyle\sum_{i=1}^n [X_i ] > c_n$. Given $\alpha \in (0, 1)$, obtain values of $c_n$ such that the size of the test converges to $\alpha$ as $n \to \infty$.

I have been able to figure out that $[X_i]$ will follow geometric distribution with parameter $(1 - e^{-\frac{1}{\lambda}})$ and will take values $0,1,2,...$. As a result, $\displaystyle\sum_{i=1}^n [X_i ]$ being the sum of $n$ geometric random variables, will follow Negative binomial Distribution. Now the point I am stuck at is the calculation of $c_n$. I tried solving for it using various approaches (CLT for instance), but I was not convinced by my answers.

How do I solve this problem?

Edit: I am including here what I did using CLT

$\displaystyle \lim_{n\to\infty}P\left( \sum_{i=1}^n [X_i ] > c_n | H_0\right) \to \alpha$

$\displaystyle \lim_{n\to\infty}P\left( \frac{\sum_{i=1}^n [X_i ]}{n} > \frac{c_n}{n} | H_0\right) \to \alpha$

$\displaystyle \lim_{n\to\infty}P\left( \frac{\sum_{i=1}^n [X_i ]}{n} - \frac{e^{-1}}{1-e^{-1}}> \frac{c_n}{n} - \frac{e^{-1}}{1-e^{-1}}\right) \to \alpha$

$\displaystyle \lim_{n\to\infty}P\left( \frac{\frac{\sum_{i=1}^n [X_i ]}{n} - \frac{e^{-1}}{1-e^{-1}}}{\left(\frac{e^{-1}}{n(1-e^{-1})^2}\right)^\frac{1}{2}}> \frac{\frac{c_n}{n} - \frac{e^{-1}}{1-e^{-1}}}{\left(\frac{e^{-1}}{n(1-e^{-1})^2}\right)^\frac{1}{2}}\right) \to \alpha$

Using CLT,

$1 - \Phi\left( \dfrac{\frac{c_n}{n} - \frac{e^{-1}}{1-e^{-1}}}{\left(\frac{e^{-1}}{n(1-e^{-1})^2}\right)^\frac{1}{2}} \right) = \alpha$

$\Phi \left( \dfrac{c_n(1 - e^{-1}) - ne^{-1}}{\sqrt ne^{\frac{-1}{2}}}\right) = 1 - \alpha$

Let $Z_\alpha$ be such that $\Phi(Z_\alpha) = 1 - \alpha$, then

$\dfrac{c_n(1 - e^{-1}) - ne^{-1}}{\sqrt ne^{\frac{-1}{2}}} = Z_\alpha$, and then the equation is solved for $c_n$.

$\endgroup$

1 Answer 1

2
$\begingroup$

Since $X_i \sim \text{Exp}(\lambda)$ you have $\lfloor X_i \rfloor \sim \text{Geom}(1-e^{-\lambda})$, so that:

$$C_n = \sum_{i=1}^n \lfloor X_i \rfloor \sim \text{NegBin}(n, e^{-\lambda}).$$

(You have already established this part in your question.) All that you require in your question is an asymptotic size of $\alpha$, so this gives you a broad range of allowable sequences for the cut-off values $\{ c_n | n \in \mathbb{N} \}$. One way to proceed is to obtain an "optimal" test by setting the cut-off to the largest value that yields a size below the asymptotic level. Another is to use the CLT to obtain a form that gives the asymptotic result without worrying about its performance over smaller samples.


Deriving the "optimal" cut-off level: To obtain a size level that is as close as possible to (but no greater than) the asymptotic level $\alpha$, we set the value $c_n$ to be the smallest value satisfying:

$$\begin{equation} \begin{aligned} \alpha \geqslant \mathbb{P} ( C_n > c_n | \lambda = 1 ) = 1-\sum_{r=0}^{c_n} \text{NegBin}(r|n,1/e). \end{aligned} \end{equation}$$

That is, we take:

$$c_n \equiv \min \Bigg\{ c =0,1,2,... \Bigg| 1-\sum_{r=0}^{c} \text{NegBin}(r|n,1/e) \leqslant \alpha \Bigg\}.$$

We will program this function below in R and look at the resulting size of the test as a function of $n$. Before we do this, we will also consider an alternative cut-off level using the central limit theorem.


Deriving the cut-off level via the CLT: If we just want an approximation with the required asymptotic size then we can use the central limit theorem to obtain the approximation:

$$C_n \sim \frac{n}{e^\lambda-1} \cdot \text{N} \Big( 1, \frac{e^\lambda}{n} \Big).$$

Applying this approximation gives:

$$\begin{equation} \begin{aligned} \alpha \geqslant \mathbb{P} ( C_n > c_n | \lambda = 1 ) \approx 1 - \Phi \Bigg( \frac{(e-1) c_n/n - 1}{\sqrt{e/n}} \Bigg). \end{aligned} \end{equation}$$

Taking $c_n$ to be the smallest (real) value satisfying this approximate inequality, we have:

$$c_n = \frac{n}{e-1} \Bigg[ 1 + \sqrt{\frac{e}{n}} \cdot \Phi^{-1}(1-\alpha) \Bigg] = \frac{n}{e-1} \Bigg[ 1 + \mathcal{O}(n^{-1/2}) \Bigg].$$

This gives an explicit function for $c_n$ which has the specified asymptotic size.


Programming and computation: We can program the "optimal" cut-off value and the approximation cut-off value as a functions of $n$ using the following R code.

library(stats);

#Function to implement test
TEST <- function(n, alpha, lambda) {
            e <-  exp(1);
            A <-  1;
            C <- -1;
            while(A > alpha) { 
                C <- C+1;
                A <- 1-pnbinom(C, n, 1-e^(-lambda), lower.tail = TRUE); }
            CC <- (n/(e^lambda-1))*(1 + sqrt(e^lambda/n)*qnorm(1-alpha));
            list(C = C, CC = CC, Size = A); }

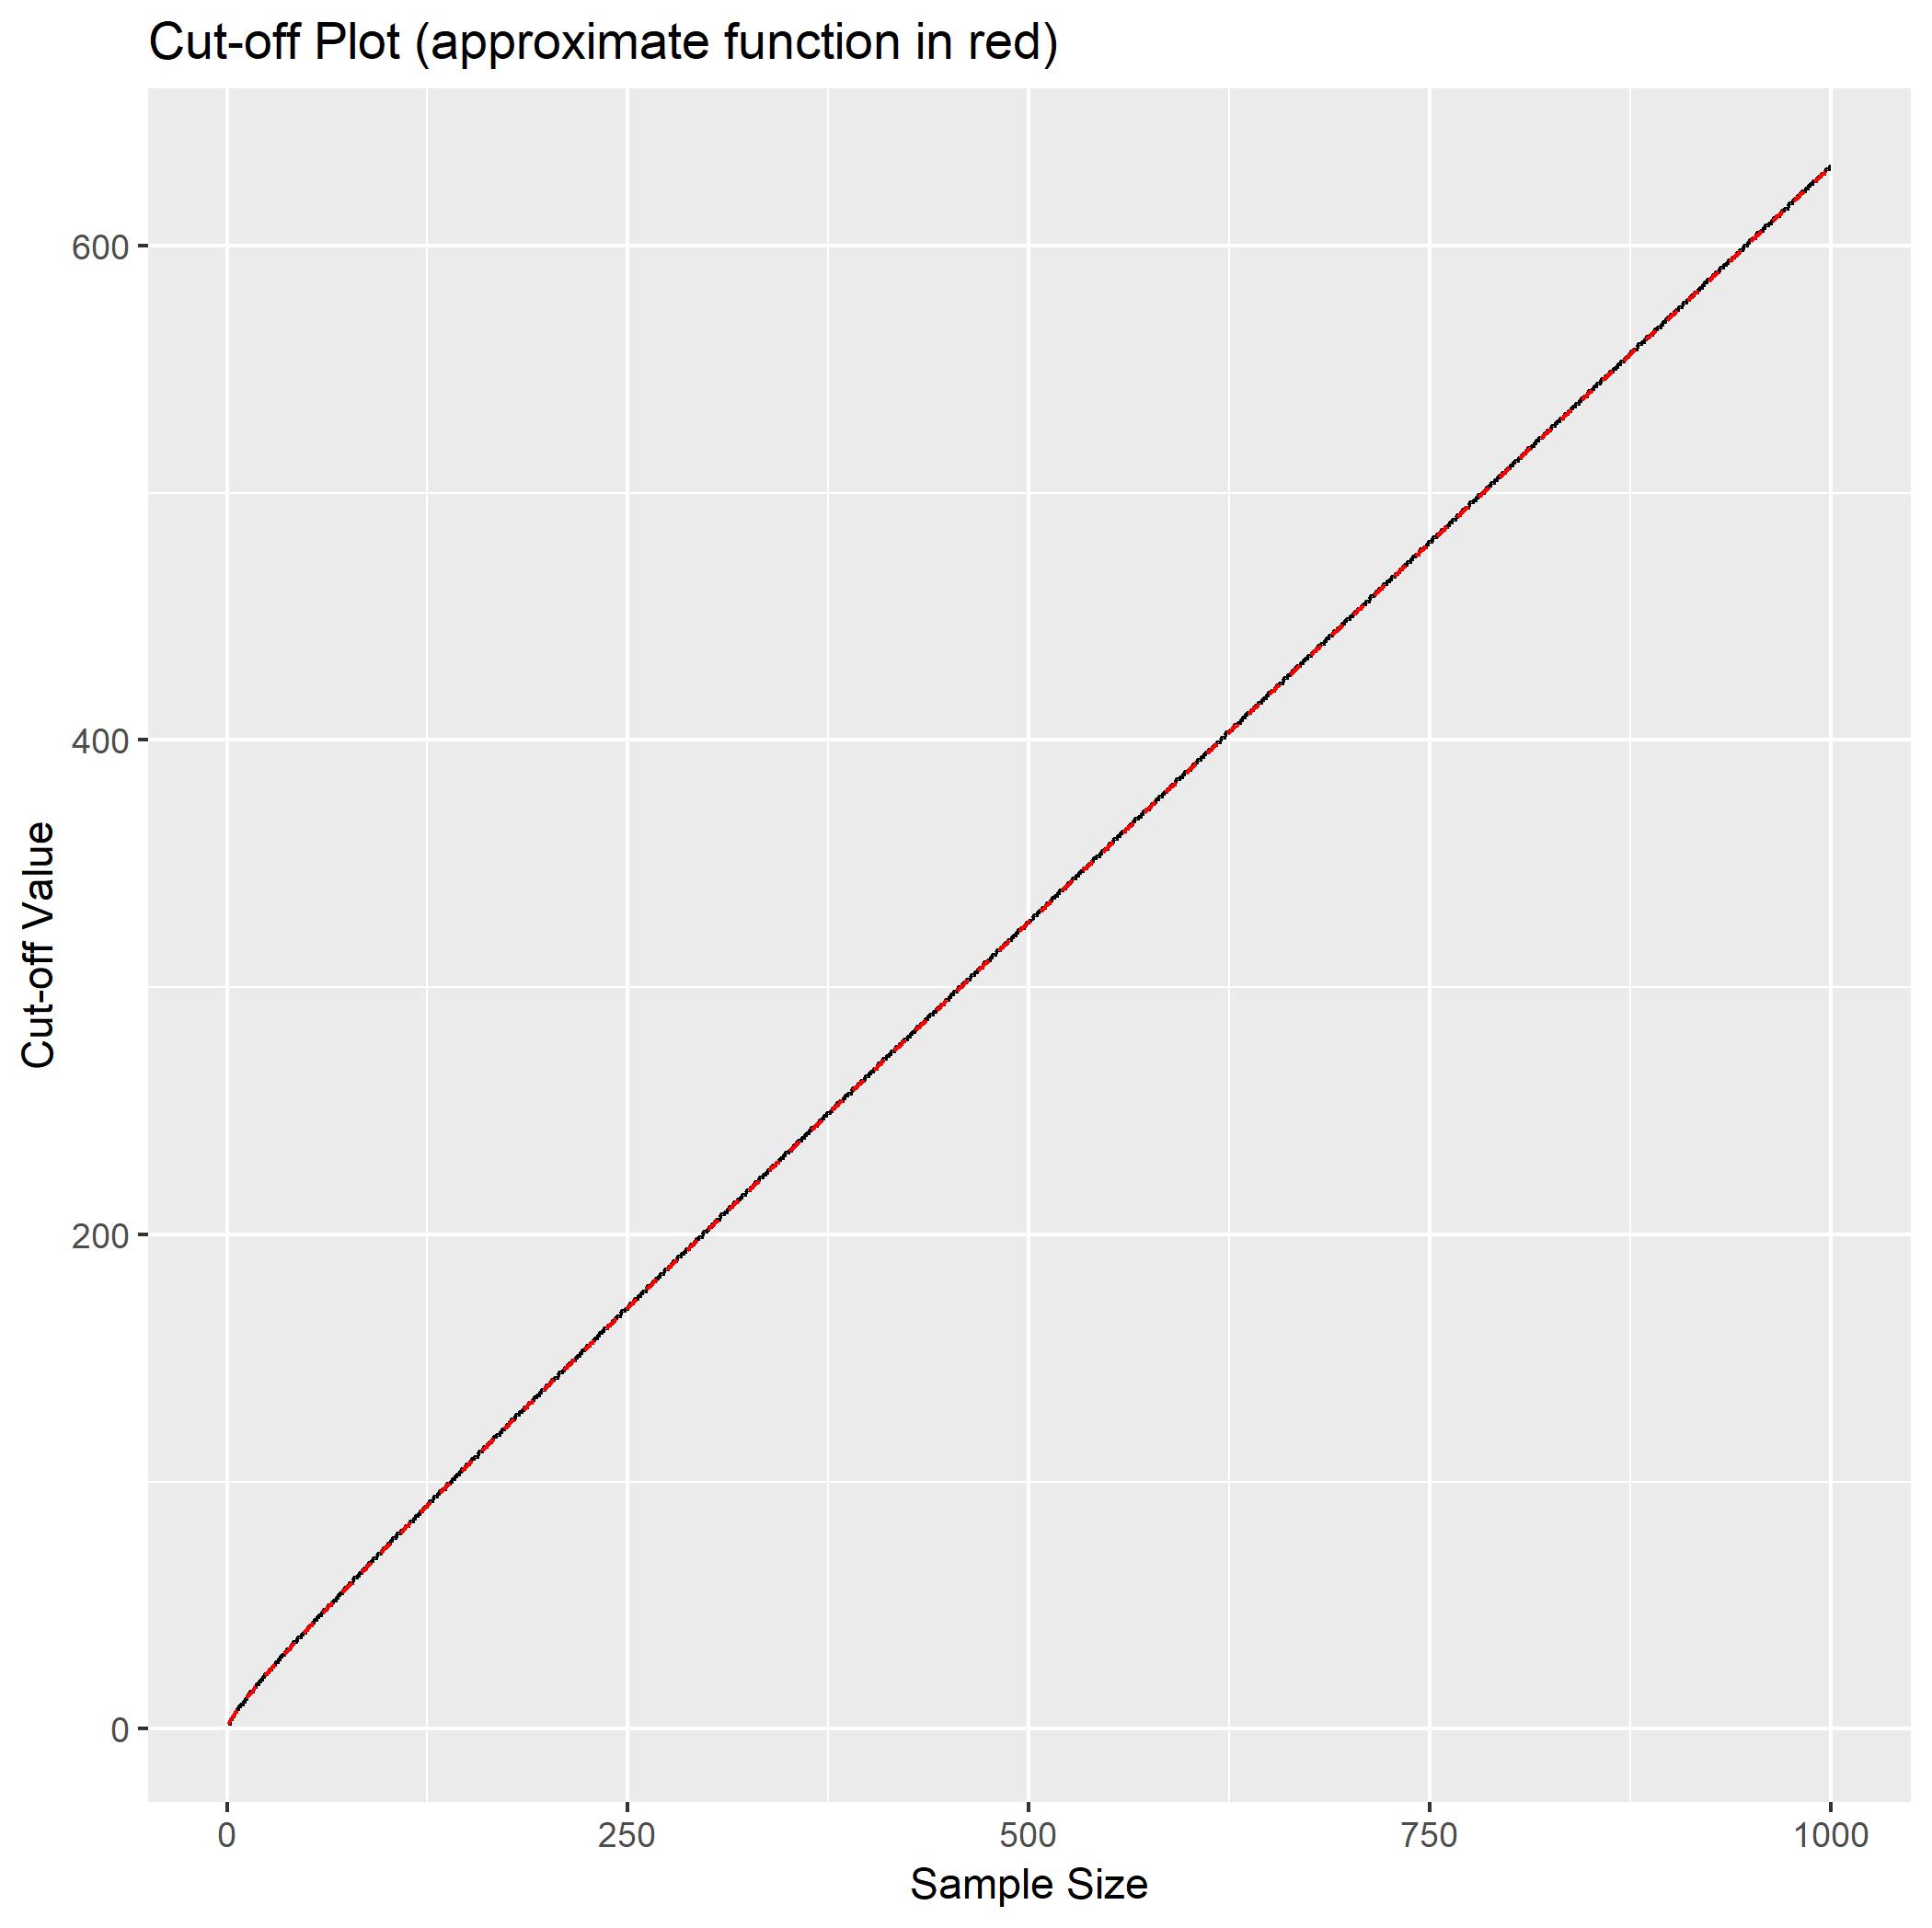
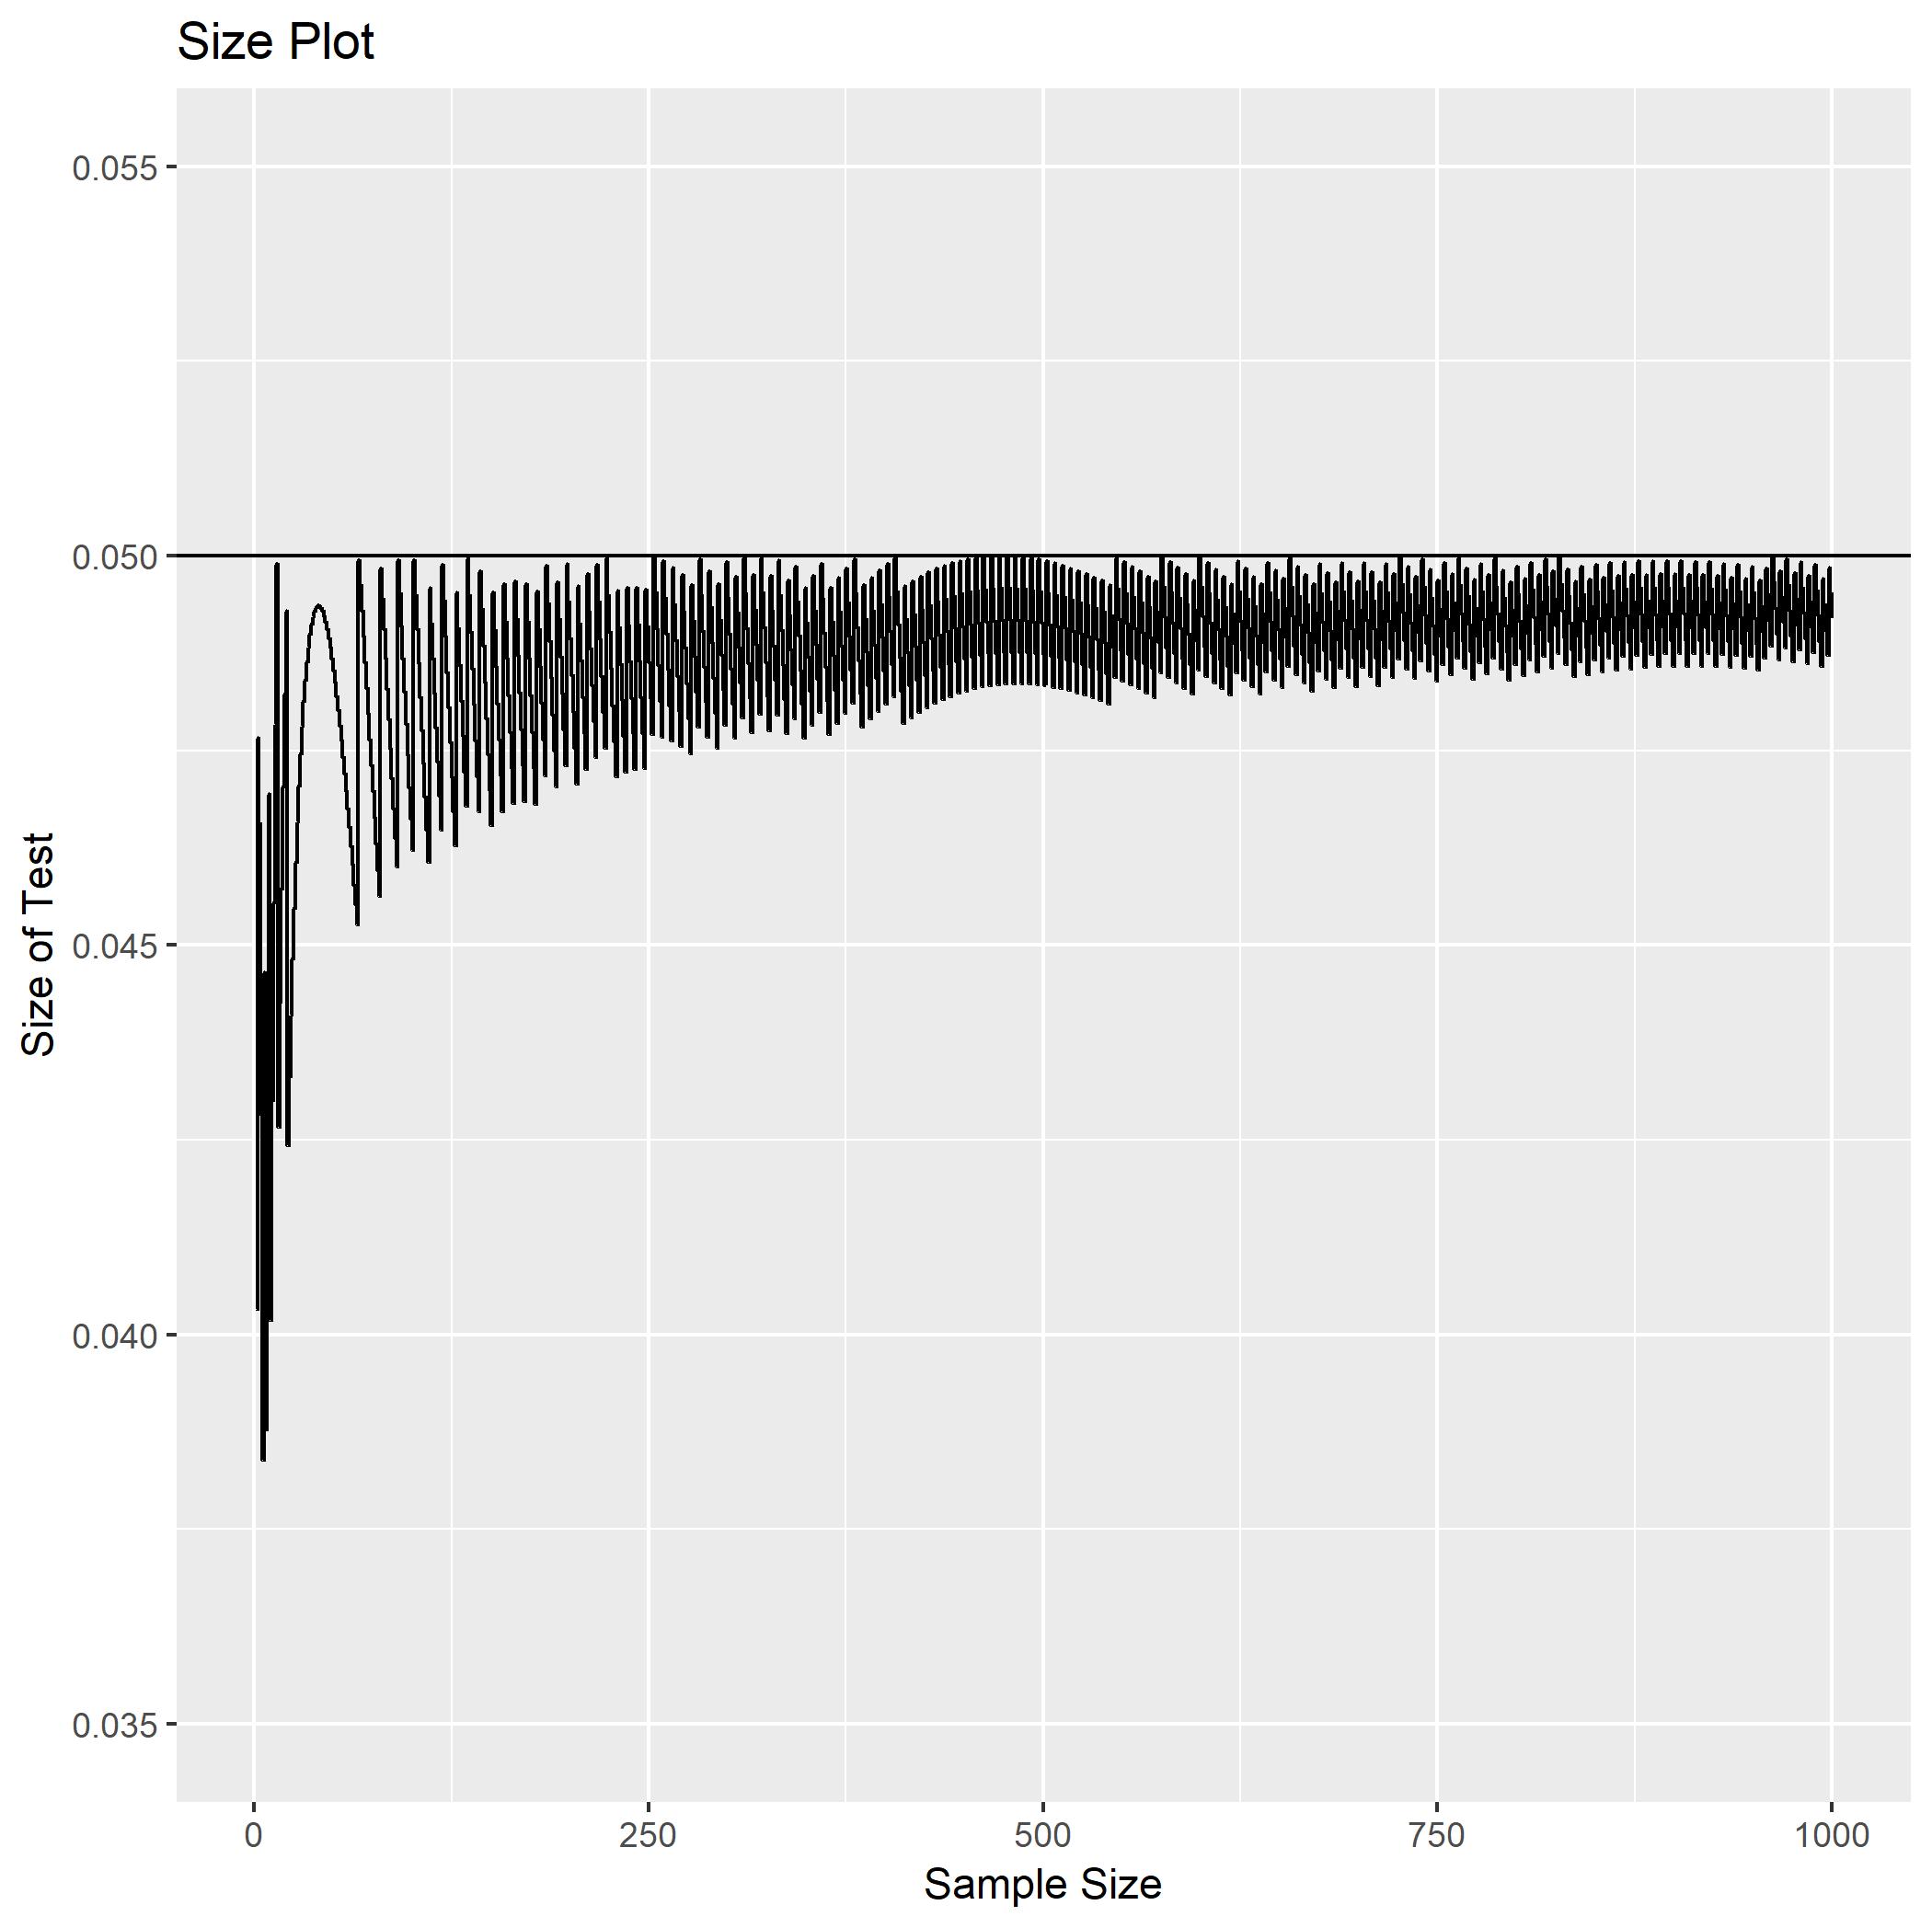
To see how close the approximation is to the "optimal" cut-off we will plot both functions, and also plot the size of the optimal test. We can see from these plots that the size of the test converges to the chosen significance level as $n \rightarrow \infty$.

library(ggplot2);

#Generate cut-off values and size for test
N      <- 1000;
lambda <- 1;
alpha  <- 0.05
GRAPH  <- data.frame(n = 1:N, C = rep(0,N), CC = rep(0,N), Size = rep(0,N));
for (n in 1:N) { OUTPUTS       <- TEST(n, alpha, lambda);
                 GRAPH$C[n]    <- OUTPUTS$C;
                 GRAPH$Size[n] <- OUTPUTS$Size;
                 GRAPH$CC[n]   <- OUTPUTS$CC; }

#Plot the size of the test over sample size
ggplot(data = GRAPH, aes(x = n, y = Size)) +
    geom_step() +
    scale_y_continuous(limits = c(0.035,0.055)) +
    geom_hline(yintercept = alpha) + 
    ggtitle('Size Plot') +
    xlab('Sample Size') + ylab('Size of Test');

#Plot the cut-off value of the test over sample size
ggplot(data = GRAPH, aes(x = n, y = C)) +
    geom_step() +
    geom_line(aes(y = CC), colour = 'red', linetype = 'dashed') +
    ggtitle('Cut-off Plot (approximate function in red)') +
    xlab('Sample Size') + ylab('Cut-off Value');

enter image description here

enter image description here

$\endgroup$
8
  • $\begingroup$ I understand the equivalence you have used. But this question is from an entrance examination that I am preparing for. So, I need to give an explicit form of $c_n$ as an answer. $\endgroup$ Commented Apr 21, 2019 at 10:52
  • $\begingroup$ I ran this code @Ben. And to verify I used the pnbinom function to calculate the size for the C values obtained by your procedure. But they all came out be almost zero. Similarly, I did for the C values that I have obtained, I calculated the size using pbeta function. In this case they all came out to be almost 1. What can you say about this? $\endgroup$ Commented Apr 21, 2019 at 12:41
  • $\begingroup$ I have now added an approximate form using the CLT, which has an explicit form. $\endgroup$
    – Ben
    Commented Apr 21, 2019 at 13:20
  • $\begingroup$ @Sanket: In order to comment intelligently on your calculations I would need to see them. $\endgroup$
    – Ben
    Commented Apr 21, 2019 at 13:21
  • $\begingroup$ I have a confusion here @Ben. Why have you taken mean parameter for Normal distribution to be $n(e^\lambda-1)$. Shouldn't it be $\dfrac{n}{(e^\lambda - 1)}$. And similarly, variance should be $\dfrac{ne^\lambda}{(e^\lambda - 1)^2}$ $\endgroup$ Commented Apr 21, 2019 at 14:08

Your Answer

By clicking “Post Your Answer”, you agree to our terms of service and acknowledge you have read our privacy policy.

Not the answer you're looking for? Browse other questions tagged or ask your own question.