First order intensity and second order intensity measure different aspects of a process that can be almost independently varied. In particular, not every point process can be regarded as an inhomogeneous Poisson process.
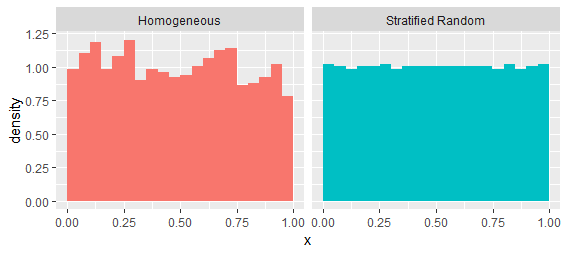
Let's deal with that last issue first. Consider a homogeneous Poisson process on the interval $[0,1].$ The gaps will tend to follow an exponential distribution. Let's compare it with a process that tends to maintain a more even spacing, a "stratified random" process. It is created by dividing the interval into a thousand non-overlapping bins and selecting one uniformly random point within each bin. They have the same first order intensities, as suggested by these estimates from a single realization of each process:

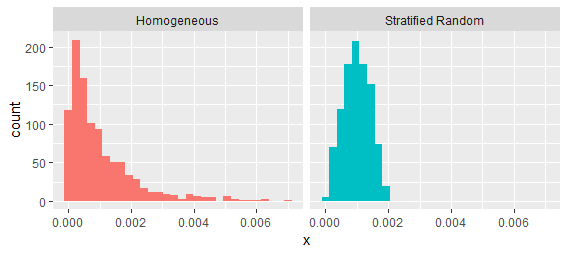
These processes are readily distinguished by examining the intervals between successive values:

It is indeed the case that certain forms of "clustering" can be characterized by the second order intensity--but not all. Clustering can mean any combination of two things:
"First order" clustering near a location $s$ just means there tend to be more points in a neighborhood of $s$ across all realizations.
"Second order" clustering near a location $s$ means the appearance of a point close to $s$ is associated with the appearance of points at other locations near $s.$
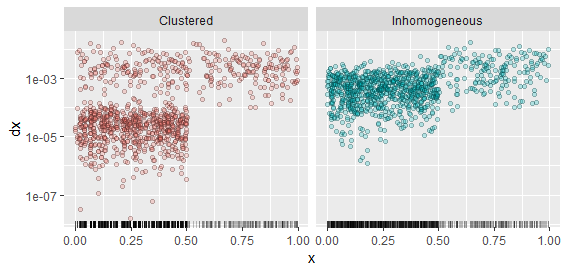
This sounds subtle, so let's contrast some examples. I have generated realizations of two processes: one that is simply inhomogeneous, having an intensity five times greater on the interval $(0,1/2]$ than on the interval $(1/2,1]$; and another that is similarly inhomogeneous but clustered in the interval $(0,1/2]$. To generate the latter, I created a sequence of iid exponential variates $dX_i$, multiplied every fifth one of them by $100,$ and computed their cumulative sum $X_i,$ finally dividing by twice their sum to place them within the range $(0,1/2].$ The process in the interval $(1/2,1]$ is a homogeneous Poisson process, just as before. This created a process in which there tend to be tight groups of four points, all widely separated from each other. Because the intervening gaps between those points are random, though, the locations where those clusters occur tend not to be the same from one realization to another. When you have the opportunity to view multiple realizations of a process, this is one way to distinguish inhomogeneity (which will persist from one realization to the next) from clustering (which may occur anywhere, not necessarily at fixed locations).

The realization of each process appears as a rug plot at the bottom. The points are a scatterplot of the $(X_i, dX_i)$ pairs: that is, the heights graph the gaps to the next point at the right. The scatterplots clearly distinguish the two processes.


