1
$\begingroup$

I am using r. I have a dataset with this distribution Raw scores
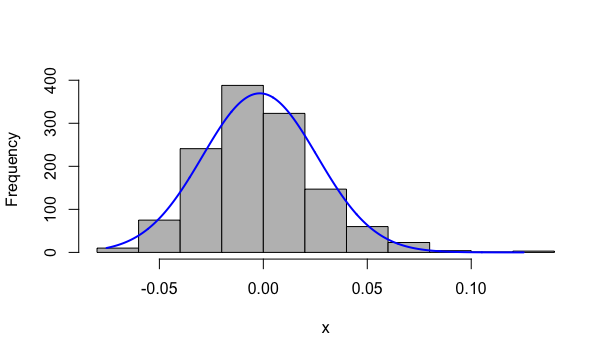
There are 1275 observations with values ranging from ~ -0.07 to mostly 0.08. I have 4 outliers that are over 0.8 (0.12, 0.12, 0.12 and 0.10). I want to convert this data into a 40-100 scaling system with a mean of 70 and a sd of 10-15. I also want around 5% of the scores to be over 90.

When I currently rescale it in r, I get a set of scores with:

mean: 62.07262
sd: 7.841568

I also only get 4 scores of over 90 due to the outliers. I tried changing the mean and sd of the scores set to 70 and 10 manually which predictably resulted in scores over 100 which I don't want. I also tried the Box-Cox transformation but that also didn't yield the results I wanted.

I would appreciate any methods to achieve the solution I want or if it is possible at all.

$\endgroup$

2 Answers 2

0
$\begingroup$

@David (+1) is correct that you need to transform your data to get the kind of scale you want. Here is a rough outline of a method that will work.

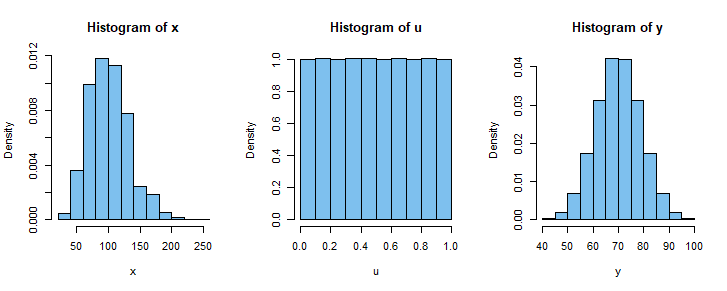
We start with data x from a right-skewed gamma distribution.

set.seed(612)
n = 1275;  x = rgamma(n, 10, .1)
summary(x)
   Min. 1st Qu.  Median    Mean 3rd Qu.    Max. 
  26.50   76.98   98.60  100.93  120.62  247.10 

Then rank the data to make them roughly uniform on $(0,1).$

u = rank(x)/(n + 1)
summary(u)    
     Min.   1st Qu.    Median      Mean   3rd Qu.      Max. 
0.0007837 0.2503918 0.5000000 0.5000000 0.7496082 0.9992163 

Finally, transforming by quantile function of $\mathsf{Norm}(\mu=70, \sigma=9),$ we get data nearly distributed according to that distribution.

y = qnorm(u, 70, 9)
summary(y) 
   Min. 1st Qu.  Median    Mean 3rd Qu.    Max. 
  41.54   63.94   70.00   70.00   76.06   98.46 

You can adjust the value of $\sigma$ to make sure the data stay within the interval $[40, 100].$

Below are histograms of x, u, and y.

enter image description here

$\endgroup$
1
  • $\begingroup$ Thank you! I will try this ASAP. I tried transforming the data using the Box-Cox method but didn't get the results I wanted. I hope this works and again thanks! $\endgroup$
    – memokerobi
    Commented Jun 12, 2019 at 18:27
1
$\begingroup$

With a mean of about 62 and an sd about 8, you already get too many over-90 scores. With a mean of 70 and sd of 10, you will always get even more!

The main problem you are facing is that your data is not normally distributed. It probably has too much skewness and/or kurtosis (check for that!)

In short, you can either set the range (40-100) or the mean and sd (70, 10), but if you want both, you cannot do it by just shifting-scaling (you'll have to manipulate the data)

$\endgroup$
2
  • $\begingroup$ with range 40-100 and mean 62 and sd 8 I only get 4 values above 90 due to 4 outliers. $\endgroup$
    – memokerobi
    Commented Jun 12, 2019 at 16:15
  • $\begingroup$ @memokerobi Then you have too little! $\endgroup$
    – David
    Commented Jun 13, 2019 at 7:06

Not the answer you're looking for? Browse other questions tagged or ask your own question.