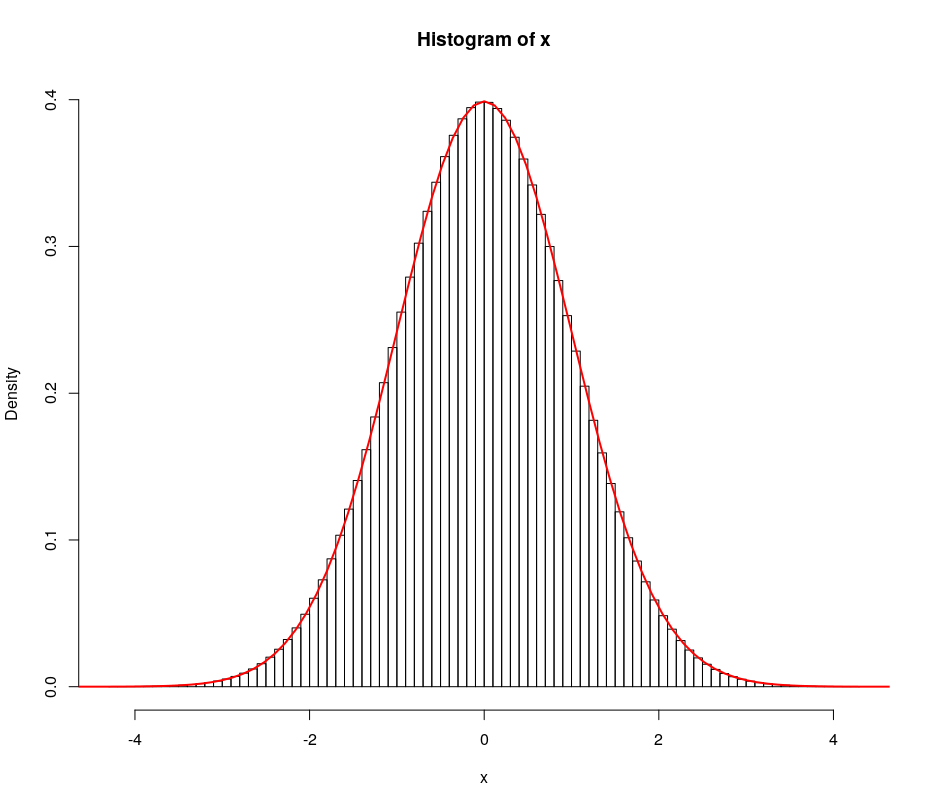
Well, by "randomness", I assume you mean "independence" (i.e: what happens on minute $x$ has nothing to do with what happens on minute $y$) for any $x$ and $y$ you may choose. If that's the case, then:
First, normality does not imply independence. Since normality tests don't care about the order of the observations, you can have "normal" data that look like (-5, -3, -1, -.5, -0.25, 0.3, 0.45, 0.9, 2, 5), where we have an upward trend or even (-5.14, 5.18, -4.01, 4.21, -3.4, 3.1, -2.22, 2.11, -1.08, 0.97, -0.54, 0.76, -0.21, 0.32) where we have strong autocorrelations. My advice would be to perform some kind of independence test. For example, if you suspect there is order-based correlation, you can check that via ACF/PACF plots
Also, the reason why your data is not significantly different from normality is that you don't have a large enough sample. Every real-world based data will eventually fail the Shapiro-test if you have enough of it as every small deviation from normality will be detectable

