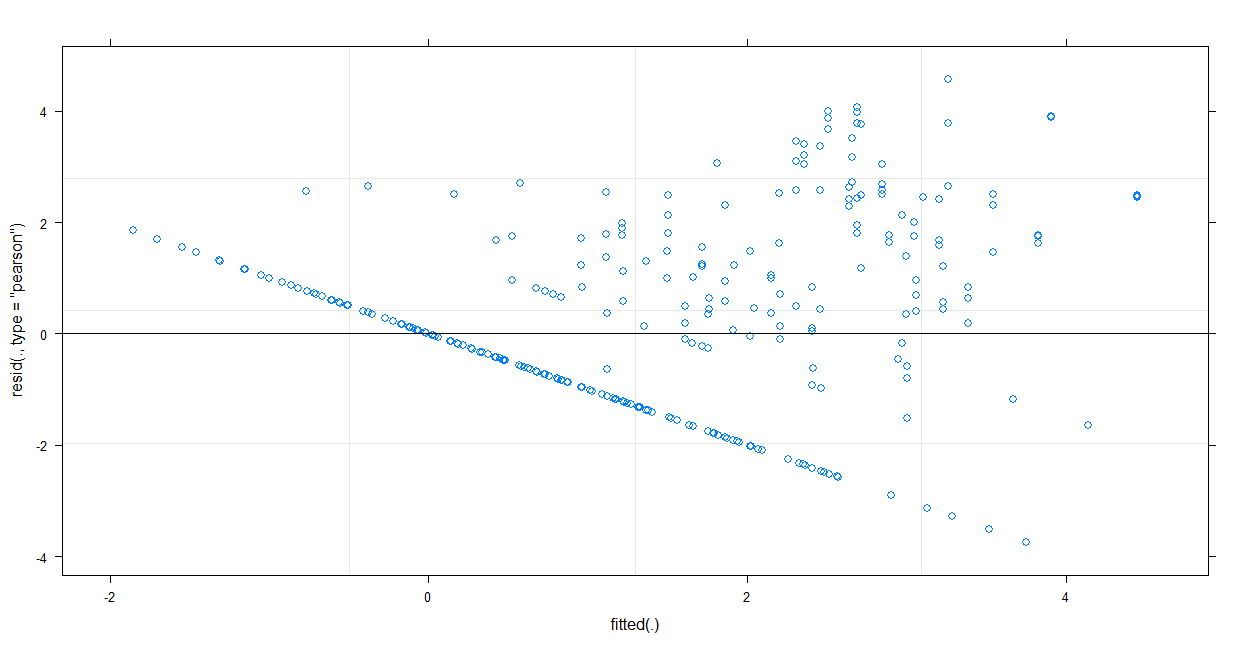
I am still learning about regression and I am currently trying to perform some basic analysis on my experimental data but I do not know how to deal with or interpret this obvious linear line in my residual plot.
How should I go about dealing with this pattern in my analysis?
The data is from microbiological counts which have had a log transformation applied. I have also used a Gaussian distribution in my analysis as I assume I need a continuous distribution if I apply a log transformation.

