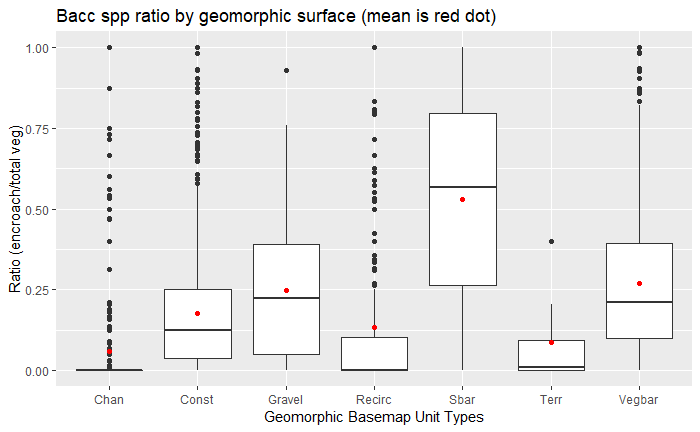
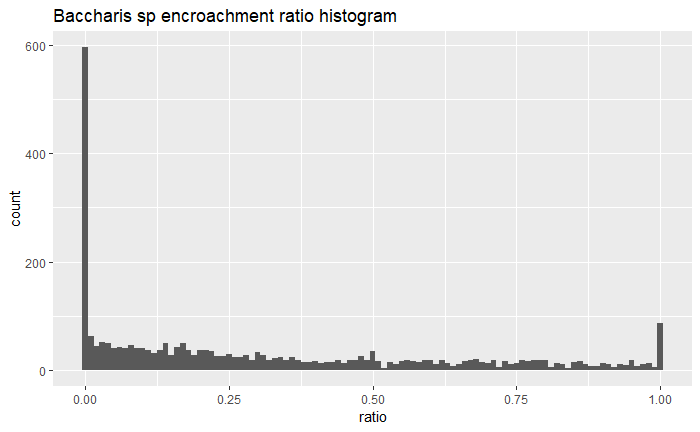
I have a fairly fundamental problem with my data, they do not suggest that they were sampled from a normal distribution. This is problematic because I would like to run some sort of analysis of variance to determine at what level of significance my fixed effects may or may not be different (see boxplot).
The data are zero inflated and semi-continuous, at the foundation the data are count data but for this analysis I've taken ratios within spatial ground units containing the counts because my units are not a uniform size and I do not wish large units to have disproportional weight in the analysis, each row in the dataset represents one unit's ratio of measurements. So I have a univariate dataset with a unit type as-factor (x) and a ratio (y) that falls between 0 and 1. Zeros in my data are real and important as they indicate no change, and 1 represents 100% change.
Standard normality transformations of these data obviously don't solve the zero inflation issue. Fundamentally I was thinking if I could find a model that would fit the data I could run an ANOVA on the modeled data, because then the residuals would at least be approximately normal. Is this correct thinking?
My next issue is finding a modeling solution for the data. I've come to realize that I should probably be looking at hurdle models as discussed here and here. But I'm having trouble finding a suitable R package for my univariate with fixed effect data, I've read extensively on GLMMadaptive, but this package seams to not work on univariate data? I keep seeing references to glmmADBM but the documentation seams spotty.
I don't think my data fit tobit (zeros are real not censored neg) but could possibly fit into tweedie, but I do have the additional spike at 1, really suggesting a need for a hurdle model to fit the data.
Any suggestions would be greatly appreciated!
Boxplot of what the data within fixed effect look like, possible hypothesis question: is Gravel different than Sbar?:


