1
$\begingroup$

I'm using the Spearman correlation coefficient test for multiple non-parametric ranked categories in excel. I used the built in rank function in excel to calculate the rank of each individuals but i have many ties because there are 10 to 208 categories for 2k instances. In the variable with 10 categories excel ranks go directly from 1 to 2100 with no intermediary ranks. Should it be doing this?

The spearmens test is giving high r values like .25 for 2747 instances and very low p values for the two ranks .25 but pearsons on the two ranks gives negligible r values like .05. This is the formula I followed: http://blog.excelmasterseries.com/2010/09/spearman-correlation-coefficient-test.html

Thank you

$\endgroup$

2 Answers 2

1
$\begingroup$

While ranking the data for use in Spearman correlation is possible with Excel formulas (like almost everything), it is not that easy.

I would suggest a little easier solution, that at the moment will work only in 32-bit Excel: use RExcel:

  1. First you'd need to download and install the R 2.15.2 for Windows.
  2. Then Open the R prompt and copy & paste the following code (which will install, among others, components that will allow quite seamless communication with Excel. All software has uninstallers in case you decide to remove them later):
makeSureInstalled<-function(package)
{
   if(length(grep(paste("^",package,"$",sep=""),noquote(installed.packages())[,1]))==0)
      install.packages(package)
library(package=package,character.only=TRUE)
}
makeSureInstalled("rcom")
installstatconnDCOM()
comRegisterServer()
comRegisterRegistry()
makeSureInstalled("RExcelInstaller")
installRExcel(ForegroundServer=TRUE)
  1. Then open your Excel, paste your data (I'll assume it comes in two collumns)
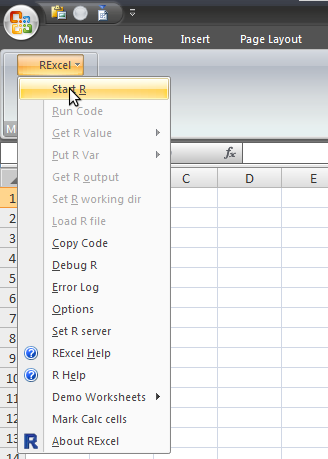
  2. On new ribbon you should click "Start R": Start R
  3. Put this formulas: enter image description here
  4. On cell H8 you will have the p-value.
  5. If you want to have the Spearman correlation coefficient $\rho$, type in this formula:

    =REval("cor.test(var1,var2,method='spearman')$estimate")

$\endgroup$
1
  • $\begingroup$ if your data is non parametric you can use excel to rank the data however is correct then use R to run Spearman $\endgroup$
    – user11279
    Commented Nov 10, 2012 at 6:55
0
$\begingroup$

Pearsons Correlation of excel ranked data gives an r which can be placed in an fdist to obtain a p value. http://udel.edu/~mcdonald/statspearman.html excel's rank function is not useful for the spearman correlation coefficient because it does not consider ties in a manner consistent with the methodology.

$\endgroup$

Your Answer

By clicking “Post Your Answer”, you agree to our terms of service and acknowledge you have read our privacy policy.