Based on the question posted here : Interrupted time series analysis for short time series in R
I am trying to analyze the effect of an intervention on the same outcome in different countries. In addition, I want to control for other time-varying variables that could potentially affect the independent variable.
In this example I have a dataset of 31 yearly measures, including potential time-varying covariates. The intervention happened in at time point 9.
Data:
dependent <- ts(c(136, 152, 128, 137, 125, 124, 108, 104,  99, 112, 129, 108,  97, 108,  98, 114, 123, 128, 137, 133, 152, 128, 118, 146, 143, 152, 166, 169, 195, 192, 181), start = 1)
confounder1 <- ts(c(8464787, 8514206, 8567384, 8625137, 8686738, 8746776, 8798234, 8836420, 8859191, 8868853, 8870848, 8873100, 8881640, 8897793, 8920710, 8951436, 8990654, 9038623, 9096165, 9162939, 9236428, 9313087, 9390168, 9466710, 9542812, 9618016, 9692131, 9764950, 9836007, 9904896, 9971638), start = 1)
confounder2 <- ts(c(24215.82, 25328.70, 30196.06, 31409.21, 32374.68, 24107.84, 25776.16, 29947.46, 32626.95, 29938.02, 30191.51, 30614.23, 29323.21, 27010.45, 29618.69, 37008.60, 42491.97, 43134.72, 46312.49, 53387.94, 55814.02, 46256.24, 52132.92, 59666.07, 57197.20, 60347.69, 59241.61, 50832.55, 51617.54, 53253.48, 54111.97), start = 1)
So far, I have tried different approaches:
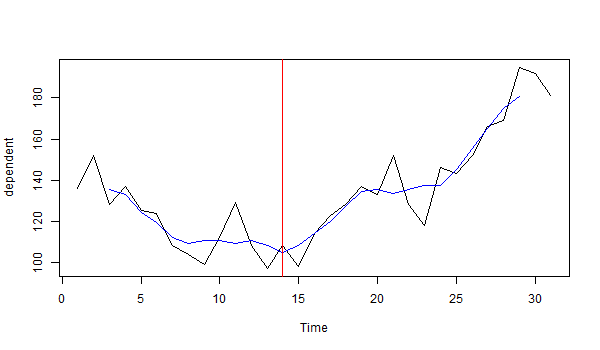
First I used the tso() function from the tsoutlierspackage.
Through tso(), "No outliers were detected."
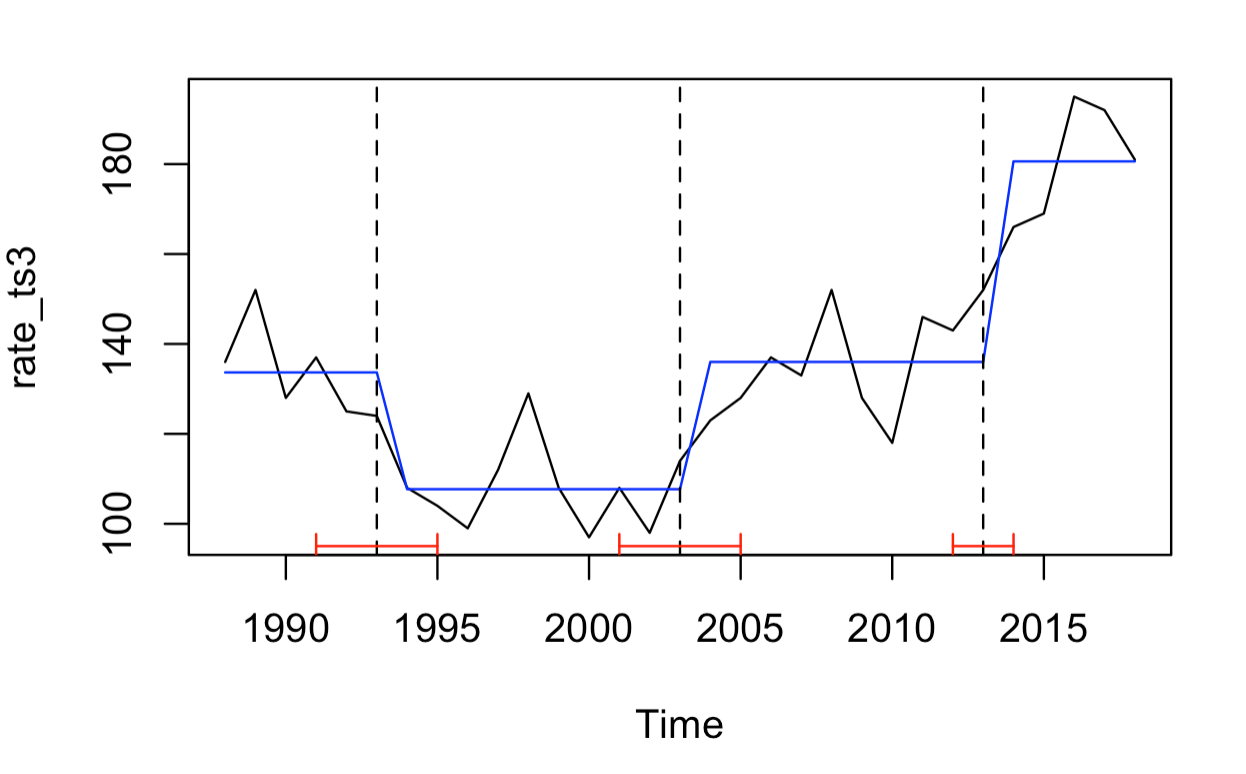
For the second approach I followed the following breakpoint analysis: https://datascienceplus.com/arima-models-and-intervention-analysis/ Applying the tutorial lead to the following result:
Three breakpoints are identified: 1993, 2003 and 2013.
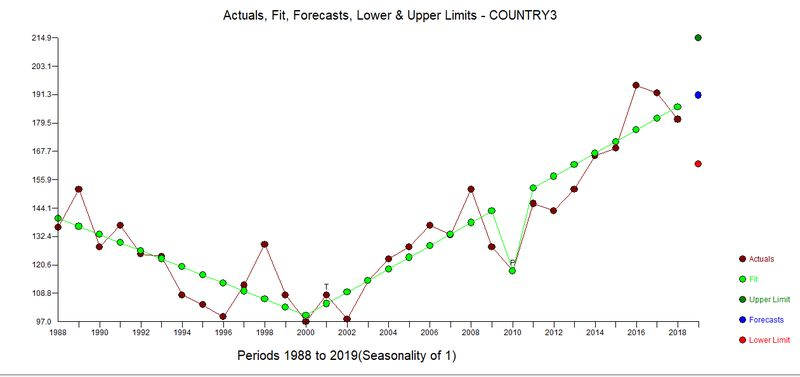
However, this result seems off, as there seem to be two trends (downward until 2000/2001 and upwards from then on) and also an outlier in 2010. The above mentioned analysis seems unable to catch this.
Using a commercial software (AUTOBOX) seems to be able to depict what is going on quite well, however, using this software for the complete analysis is not an option.
Therefore, my question is: What (free) software/function/application can I use to properly identify the model and to gain insights on (and quantify!) the possible effect of the intervention, also including time-varying confounders, especially when the change cannot be modeled through step/level change?
EDIT:
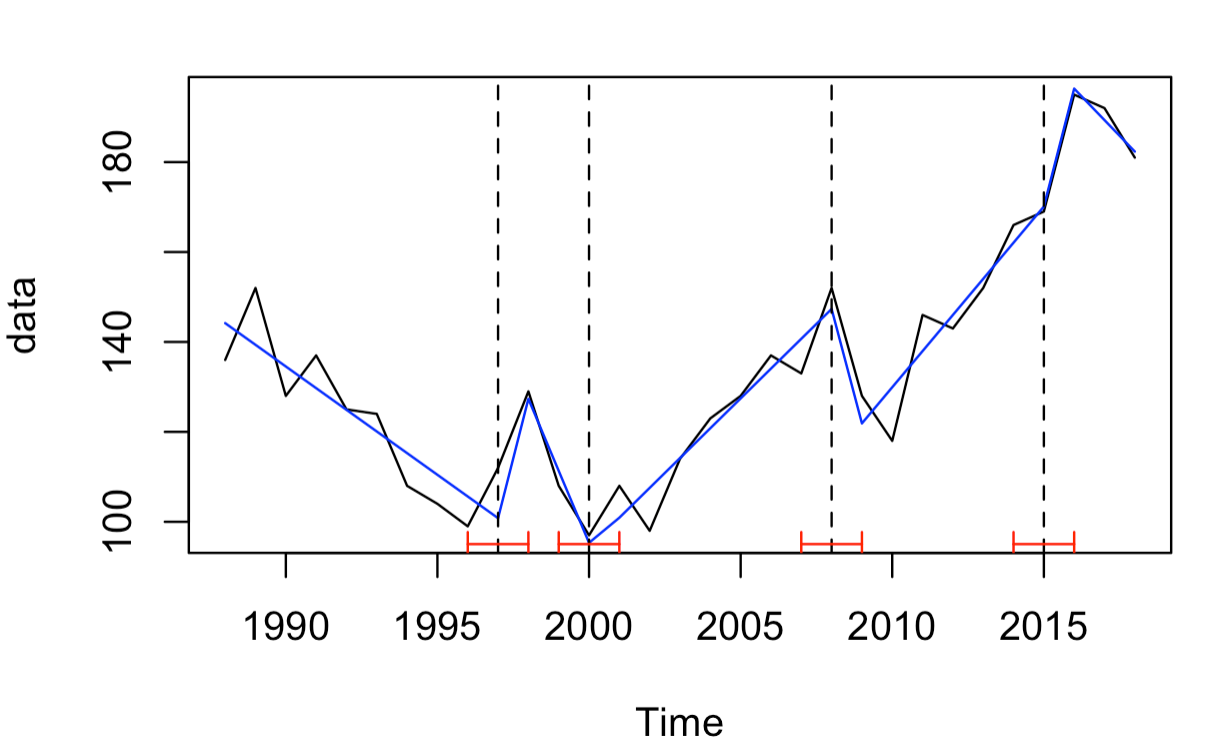
I realized I used the strucchange package and breakpoint function incorrectly (only allowing for level changes, not trend changes). This is what the results of the breakpoint analysis should look like, much closer to what I was expecting to find:
However, some questions still remain:
- How can I take possible covariates and ARIMA structure into account when trying to identify breakpoints?
- How can I quantify the change in level/trend following a break point?


