5
$\begingroup$

I see pro-processing with Normalization which aligns data between 0 and 1.

and standardization makes zero mean and unit variance. And multiple standardization techniques follow on..

Any clear definition at what cases what should be used ?

Thanks in Advance !!

$\endgroup$

2 Answers 2

5
$\begingroup$

In unsupervised learning, the scaling of the features has a great influence on the result. If a feature has a variance that is many times greater, it can dominate the target function of the algorithm. Therefore, it is of great importance to scale the input data in a way that their variability matches or at least does not contradict the semantics. There are several transformation methods to put the features into a comparable form. These use different forms of normalization or standardization according to their context. To clarify the differences, I will briefly explain the terms, what is done and show you some graphics(compare the scales) from ski-kit learn and my own:

Normalization: In normalization a vector is divided by a norm of a vector to set its length to a certain value. Often, rescaling by the minimum and length of the vector is used here so that ALL elements lie between 0 and 1.
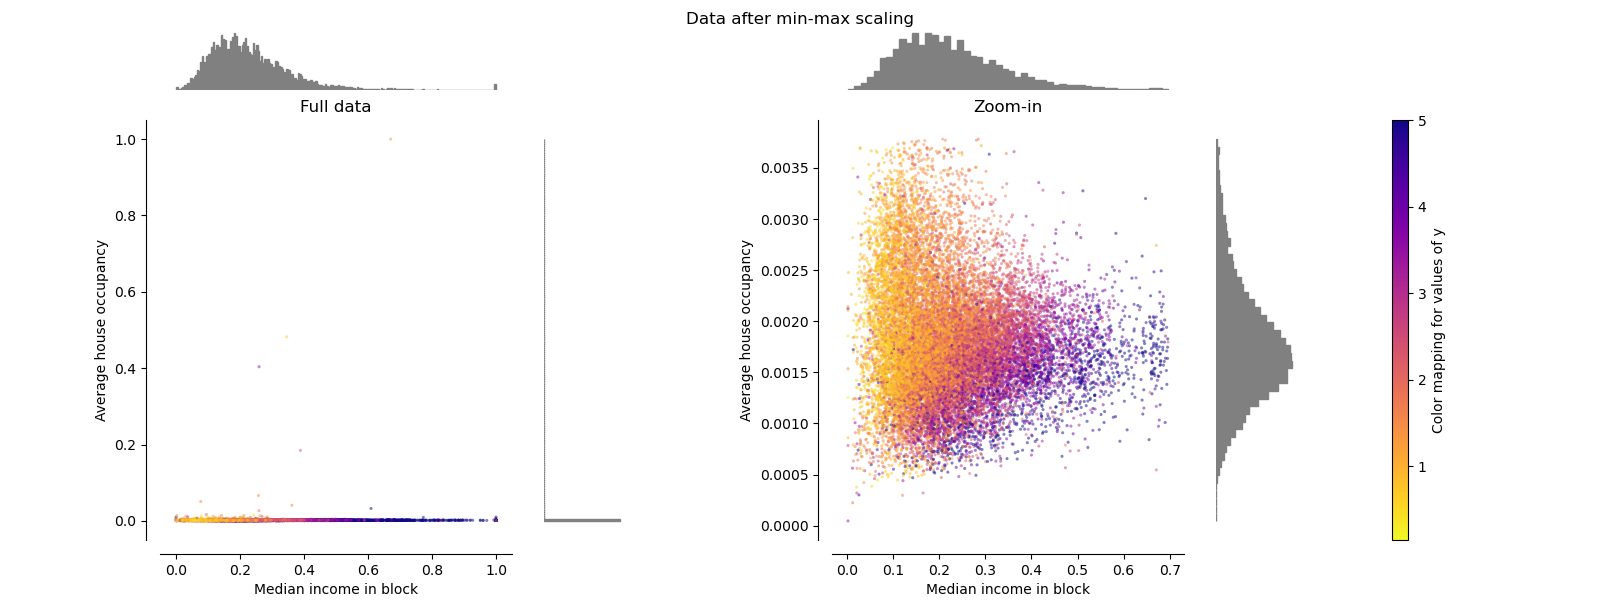
normal

Standardization: Standardization involves subtracting a measure of position from a vector and then dividing it by a measure of size. This changes its position and sets the length to a specific value. So standardization is a shift and a normalization.
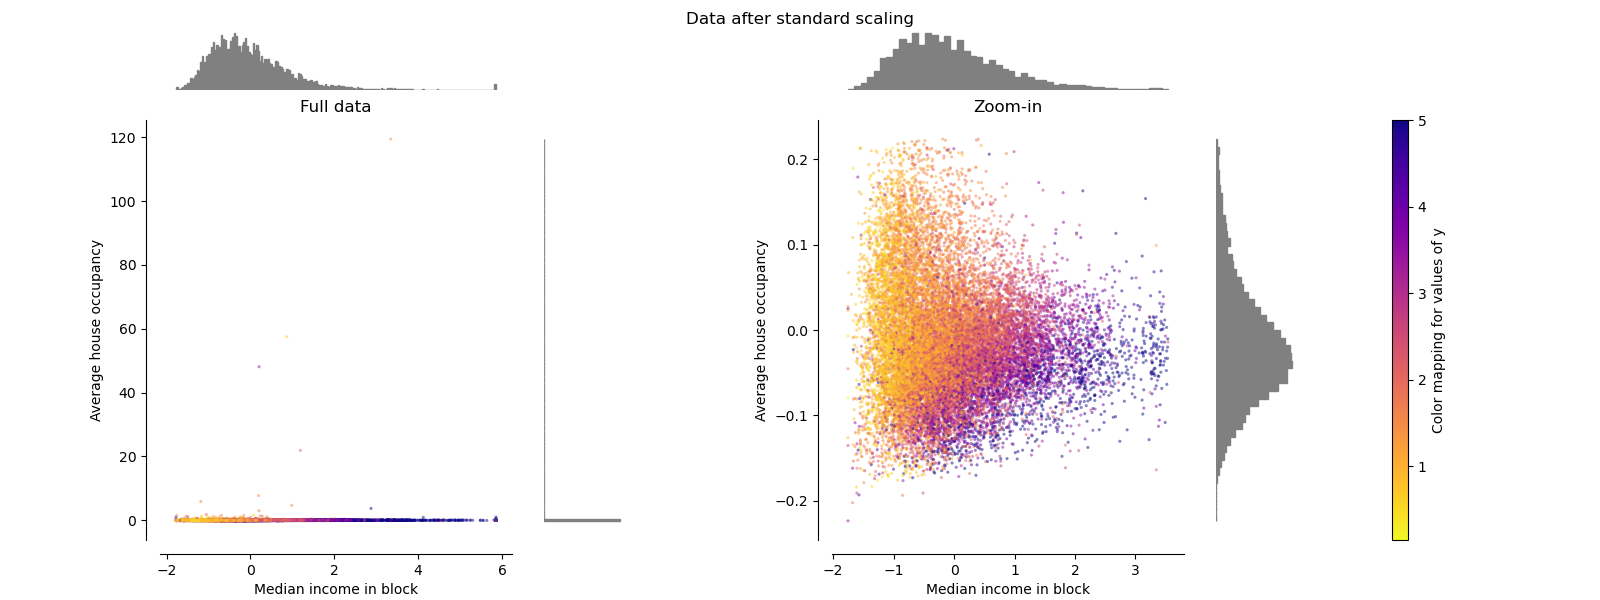
standard

In summary, it can be said that standardization gives the features a comparable scaling, but without highlighting outliers. By contrast, normalization gives the features exactly the same scaling. This can be very useful for comparing the variance of different features in one plot (like the boxplot on the right) or in several plots of the same scale. To identify outliers, I recommend the Robust transformation, which leads to the box plot on the right.
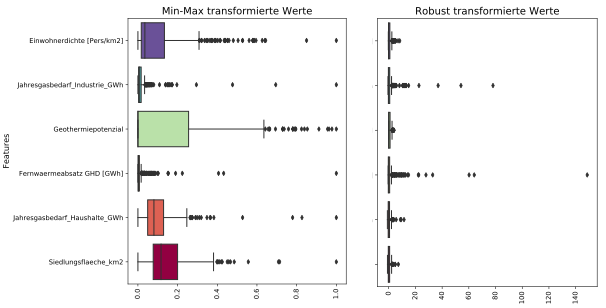
Robust Transformation

The features $X$ are scaled with the interquartile range $x_{75} - x_{25}$ and shifted by the median value $\tilde{x}$.

$$ Z = \frac{X}{x_{75} - x_{25}} - \tilde{x} $$

As a result, the mean 50% of the values become very small, but the big outliers are only slightly affected. With an optical limit value procedure, these outliers can therefore be identified very easily.

$\endgroup$
7
$\begingroup$

Standardisation

There are many reasons why we'd want to stardardise the data. The two most common ones are:

  1. In the cases where we want to apply an algorithm for which it would make sense to standardise. For instance, say you have a dataset where each row is a person and for each person you have two columns: The weight in kgs and the Height in meters. You want to cluster these people into groups where individuals in the same group would have similar weight and height. However, in your dataset the individuals have weights that vary between 50Kgs and 150Kgs (so they are cases of differences of 100) whereas the heights vary from 1.50 to 2.00 (so the differences here are 0.50 at most). Hence, if you apply a clustering algorithm (say K-means with Euclidean distance) the differences of the different weights would contribute much more to the calculated distance compared to the differences in heights and you'll end up with a really bad clustering that is influenced heavily by one and not by both variables you have. If you stadardise your two variables before you run the algorithm, the effects of the two variables in the calculated distance would be fairly similar as both would have zero mean and unit variance.
  2. In the cases where we want to "index" something so that we know how far away it is from the "normal". For instance, say again that you have the same dataset as before but now you know that these people are all Olympic champion swimmers. You report on one of these individuals that you think he is the best; say Phelps, and you say that he weights 88kgs and he is 1.88m tall. You don't really know whether this person is just about average in this dataset of Olympic swimmers or if he is too tall/too short, has more body much etc. Now, if you knew that his standarised height is 0.2 and his standardised weight is 0.5 you know that he is just about average because he is relatively close to 0. However, if you take Phelp's and you add him into a dataset of basketball palyers, his standardised weight then become -0.4 and hist standardised height is now -2.00 (example values). That already tells you at a glance that his is an significantly shorther than the average baskeball player because you know that people that have a standardised value below -1.64 or above 1.64 are significantly outside the "average" at a significance level of 95%. Thus the standarised values give you an idea how a measurement is compared to everything else in the dataset.

Normalisation

Again, many reasons here as well, here are two common ones (You can normalise a value between any two values. For the examples below, I will assume that you normalised values between 0 and 100):

  1. We sometimes want to have an indication of the ranking of a value compared to the rest. For instance say that you have a model that predicts probabilities that some people have to donate to charities. You look at the data and you see that this probabilities are between 4% and 93% and most of the people are above 85%. You can then normalise these values so that the 4% become the new 0 propensity score and the 93% becomes your new 100 propensity score and everyone in between are changed accordingly. Now, if you pick a random person and you see that his propensity is 40. You know instantly that his propensity is has that great and you can find better ones to target propensity. However, if you look at the original probability value, this could be 84% which seems fine. The normalised score would then give you an extra detail that you can pick up someone else who is more likely to donate.
  2. It's very user friendly transforamtion as people can easily grasp numbers that are in the 0-100 scale.

To summarise. Standardisation is something that is necessary for some cases in machine learning, deep learning and it's really insightful to identify outliers. Normalisation is not something necessary but it is very user friendly and it gives you an idea of ranking as you can see where the score lies compared to the rest. The difference is that with normalisation, the scores of 0 and 100 doesn't necessarily mean that these two values are outliers! It's just the lowest and highest scores in your dataset. Similarly for Standarisation, the scores or 3.55 although extremely high and probably an outlier, doesn't mean that it'st the highest value you may have in the dataset. Both transformations are useful for different cases.

$\endgroup$

Your Answer

By clicking “Post Your Answer”, you agree to our terms of service and acknowledge you have read our privacy policy.

Not the answer you're looking for? Browse other questions tagged or ask your own question.