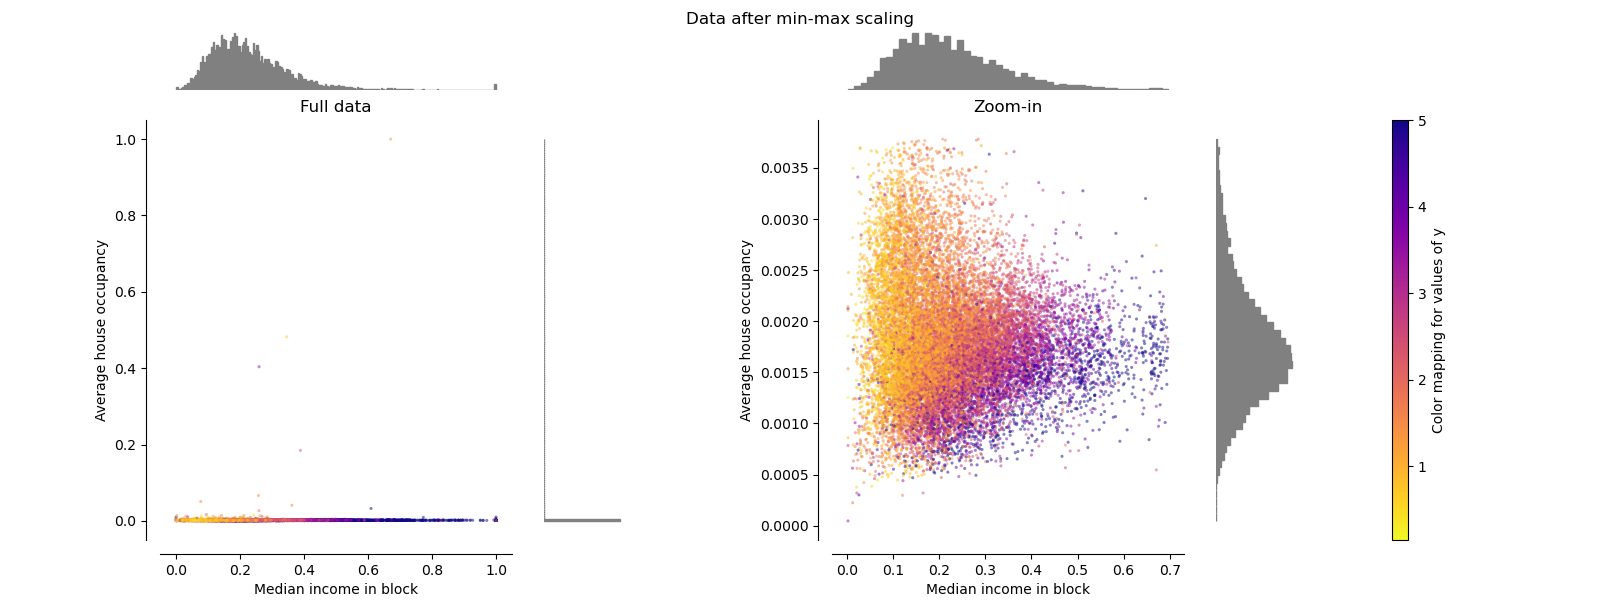
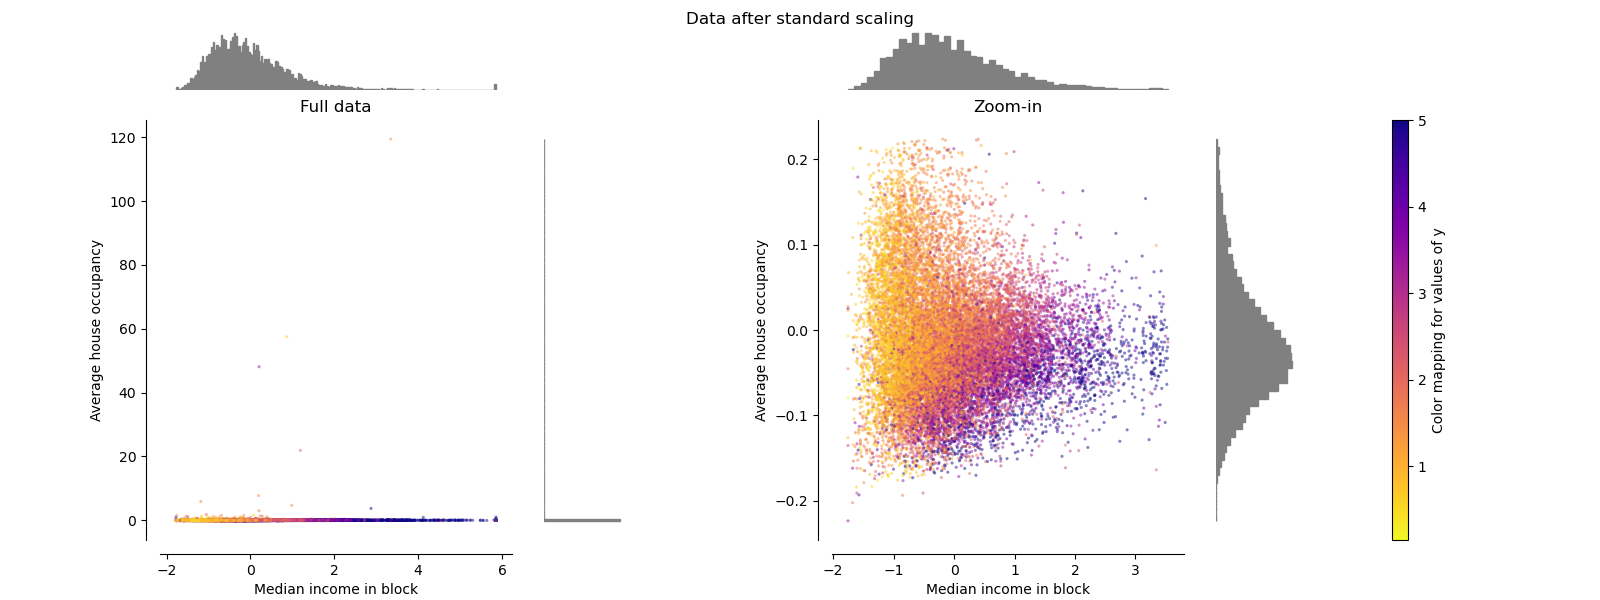
In unsupervised learning, the scaling of the features has a great influence on the result. If a feature has a variance that is many times greater, it can dominate the target function of the algorithm. Therefore, it is of great importance to scale the input data in a way that their variability matches or at least does not contradict the semantics. There are several transformation methods to put the features into a comparable form. These use different forms of normalization or standardization according to their context. To clarify the differences, I will briefly explain the terms, what is done and show you some graphics(compare the scales) from ski-kit learn and my own:
Normalization:
In normalization a vector is divided by a norm of a vector to set its length to a certain value. Often, rescaling by the minimum and length of the vector is used here so that ALL elements lie between 0 and 1.

Standardization:
Standardization involves subtracting a measure of position from a vector and then dividing it by a measure of size. This changes its position and sets the length to a specific value. So standardization is a shift and a normalization.

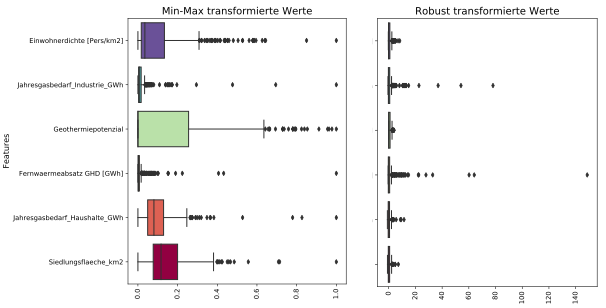
In summary, it can be said that standardization gives the features a comparable scaling, but without highlighting outliers. By contrast, normalization gives the features exactly the same scaling. This can be very useful for comparing the variance of different features in one plot (like the boxplot on the right) or in several plots of the same scale. To identify outliers, I recommend the Robust transformation, which leads to the box plot on the right.

Robust Transformation
The features $X$ are scaled with the interquartile range $x_{75} - x_{25}$ and shifted by the median value $\tilde{x}$.
$$
Z = \frac{X}{x_{75} - x_{25}} - \tilde{x}
$$
As a result, the mean 50% of the values become very small, but the big outliers are only slightly affected. With an optical limit value procedure, these outliers can therefore be identified very easily.


