2
$\begingroup$

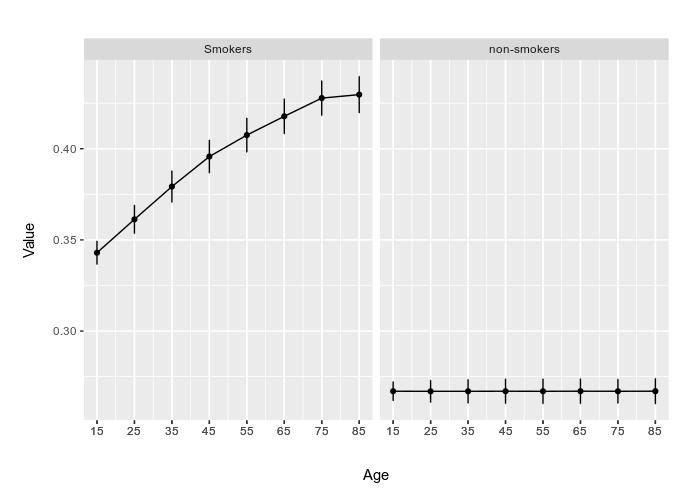
For explanatory purposes, I will give a fake example to understand my question (and goal). Let's suppose I get from different published papers data about the concentration of a substance (subst.concent) depending on age (age) and if they are smokers or non-smokers (smoking). Following this example, I find that for smokers, the concentration of that substance increase as age increase, while for non-smokers there is no effect. Here a graph of what I find with my actual data (but modified to the "smokers" example):

enter image description here

I would like to test the effect of both age and smoking in subst.concent. I would expect to find a significant interaction between age and smoking. I tried a linear regression using the mean of each "population", however, I don't think this is the most appropriate since it doesn't consider the SD and for instance, the model gives an of 1, when I guess all the variance is not explained by my two variables.

How could I test the age and smoking effect in my subst.concent and the magnitude of their effect using both the mean and the SD?

Thanks in advance!!!

$\endgroup$
8
  • 1
    $\begingroup$ Do you have a single mean from each paper? Or do papers report multiple means? In the latter case, are these cross-sectional studies, such that the 15 year old subjects are not the same people as the 25 year old subjects or are these longitudinal studies such that the same group of people was measured when they were 15 and when they were 25? (I assume that there is no overlap between smokers and non-smokers or can the same subject also appear in both of these groups?) $\endgroup$
    – Wolfgang
    Commented Apr 27, 2020 at 9:18
  • $\begingroup$ Thanks for your time @Wolfgang. Regarding your first question, I have one single mean per combination of levels. That is, for instance, for non-smokers being 15 years old one mean value, for non-smokers being 25 years old, another mean value, etc. All data comes maybe from 6/7 papers, so, in some of them, I have several means. Regarding if the studies are cross-sectional, yes, they are not longitudinal. They take different people for each group. And regarding overlapping within the smoking variable, no, they are different subjects for smokers and non-smokers. $\endgroup$
    – Dekike
    Commented Apr 27, 2020 at 11:38
  • $\begingroup$ @Wolfgang, Did you think something? $\endgroup$
    – Dekike
    Commented Apr 28, 2020 at 21:39
  • $\begingroup$ Isn't meta-analysis one approach to addressing your question? A search on CV for meta-analysis produced over 1,000 hits. $\endgroup$
    – user234562
    Commented Apr 29, 2020 at 17:01
  • $\begingroup$ It might be, however, since I am new on that, I didn't know if someone could shed light on that saying specifically which method should be the best. Thanks for your time! $\endgroup$
    – Dekike
    Commented Apr 29, 2020 at 17:18

1 Answer 1

0
$\begingroup$

Yes, you can address this from a meta-analytic perspective. Let $y_{ij}$ be the observed concentration and $\mbox{SD}_{ij}$ and $n_{ij}$ the corresponding SD and sample size for the $i$th study and $j$th group within the study (so for a particular age and smoking status). Some studies may just report the results for a single group, which is fine. Then $v_{ij} = \mbox{SD}_{ij}^2 / n_{ij}$ is the estimated sampling variance of $y_{ij}$ if we assume that the concentration values are like means. Also, let $\mbox{age}_{ij}$ and $\mbox{smoke}_{ij}$ denote the age and smoking status (coded 0/1) for the groups.

Once you have estimates with corresponding sampling variances (and possibly some predictor variables), you can think of this as a meta-analysis. However, your data have a multilevel structure (since you have studies reporting concentration values for multiple groups), so you should use a multilevel meta-analytic model. Such a model is described by Konstantopoulos (2011). An example illustrating the analysis of such data is given here:

http://www.metafor-project.org/doku.php/analyses:konstantopoulos2011

In your case, think "study = district" and "group = school". Then you also want to add age and smoking status as predictors to the model (and maybe their interaction). You can also model non-linear associations for the age variable (e.g., using polynomials or splines).

References

Konstantopoulos, S. (2011). Fixed effects and variance components estimation in three-level meta-analysis. Research Synthesis Methods, 2(1), 61-76.

$\endgroup$
1
  • 1
    $\begingroup$ Thank you very much @Wolfgang. You gave me a clue to follow. I will look at the reference and follow your instructions. Thanks for your time. $\endgroup$
    – Dekike
    Commented May 1, 2020 at 14:20

Your Answer

By clicking “Post Your Answer”, you agree to our terms of service and acknowledge you have read our privacy policy.

Not the answer you're looking for? Browse other questions tagged or ask your own question.