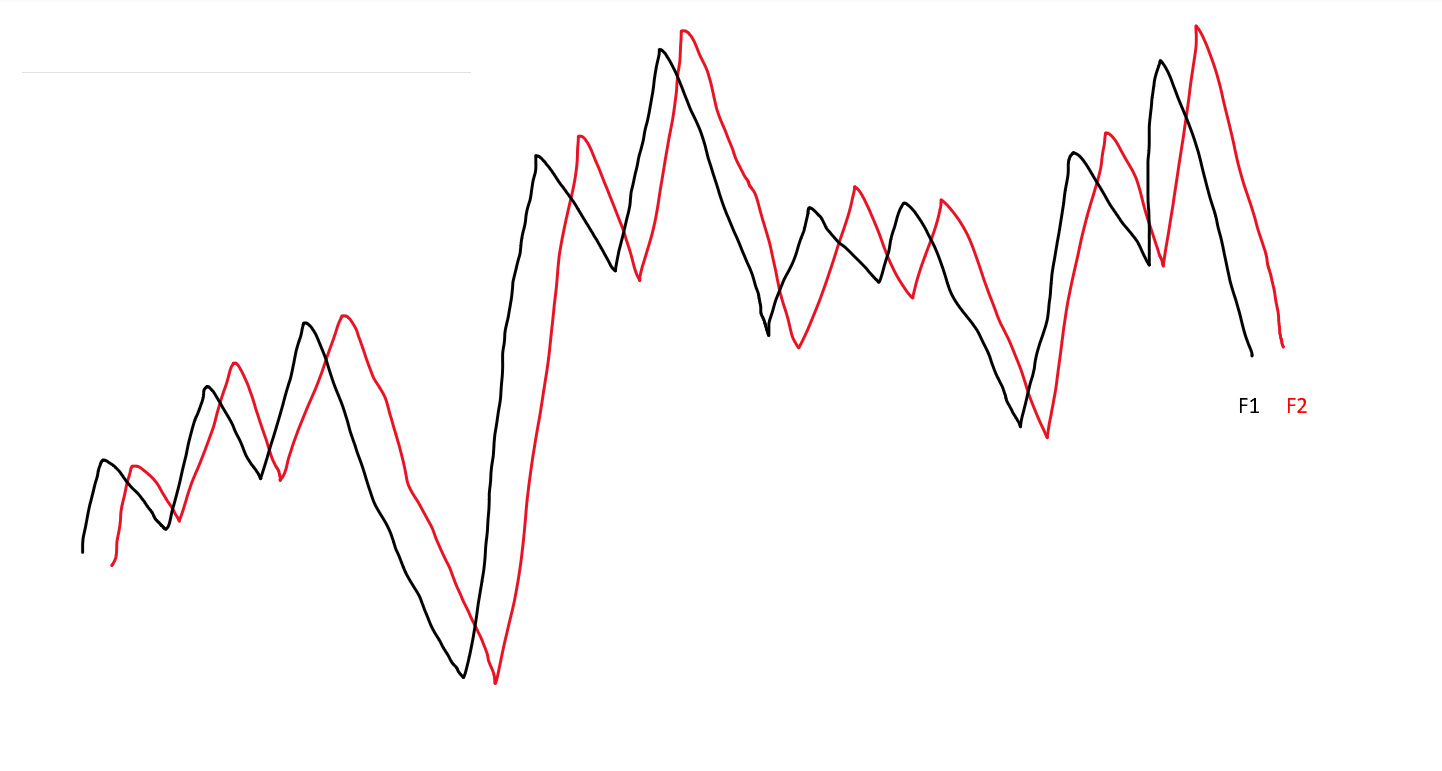
I am wondering if these two lines, F1 and F2, representing time series, would still be considered "random walk", once the relationship between the two was discovered? Could this relationship ever even happen if a process was truly random walk? What would these two time series be considered instead, if not random walk? Is there a way to test if a trend is a random walk or has a deterministic trend? In the examples I have seen this seems to be done manually.
Please excuse the quick drawings, I am trying to learn about stationary vs. non-stationary data and I'm trying to check my understanding of what a "random walk" is. My maths knowledge is not advanced so please keep any explanation simple and understandable - thank you!

