I am doing an university project, and a big part of my data is ordinal (Likert scale). In some of the hypothesis I have Likert scales both as DV and IV, so for example IV is I shop on a tight budget (1-7) and the DV is I tend to buy price reduced suboptimal food (again level of agreement from 1 to 7). So under other circumstances I would use one way ANOVA, however as the data is ordinal, this does not seem a safe choice. I have looked into running the Kruskal-Wallis test, however it is stated that it is not as punctual and people sometimes run ANOVA on Likert scales anyway. So my question is, what do you think makes more sense to do? Or maybe there is another third option? Thanks in advance
-
$\begingroup$ You don't say what null hypothesis you are testing? Are you comparing DV and IV groups to see if their Likert means or medians are signif. different? // ANOVA and K-W are for comparing more than 2 groups. Maybe your choice is between Welch t and 2-sample Wilcoxon. // Please say what you are trying to find out and what null and alternative hypotheses you have in mind. $\endgroup$– BruceETCommented May 10, 2020 at 23:09
1 Answer
Here are some simulated data for DV and IV for purposes of illustration.
set.seed(2020)
dv = sample(1:7, 100, rep=T, p=c(1,2,2,3,3,4,4))
iv = sample(1:7, 150, rep=T, p=c(1,2,4,3,2,1,1))

tabulate(dv); tabulate(iv)
[1]  6  8 11 21 13 21 20  # DV
[1] 13 27 49 20 18 11 12  # IV

summary(dv); summary(iv)
Min. 1st Qu.  Median    Mean 3rd Qu.    Max.  # DV
1.00    3.75    5.00    4.70    6.00    7.00
Min. 1st Qu.  Median    Mean 3rd Qu.    Max.  # IV
1.00    2.00    3.00    3.56    5.00    7.00
Roughly speaking, DV Likert scores seem to be generally higher than those for IV. A two-sample Wilcoxon test shows that DV is significantly (P-value near 0) 'shifted to the right' compared with IV.
wilcox.test(dv, iv)

        Wilcoxon rank sum test with continuity correction

data:  dv and iv
W = 10236, p-value = 7.337e-07
alternative hypothesis: true location shift is not equal to 0
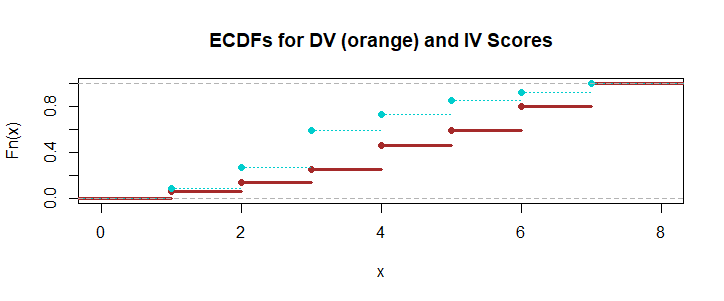
An 'empirical CDF' plot of data is a stairstep plot based on sorted observations. Suppose there are $n$ observations. Starting at height $0$ at left, if there are $k$ observations at a value, the plot jumps up by $k/n$ at that value. At the right the ECDF plot reaches height $1.$
If the ECDF of one sample lies mainly to the right of the ECDF of another, then the first sample is said to be located to the right of the second. Here DV is located to the right of IV.
plot(ecdf(dv), col="brown", xlim=c(0,8), lwd=3,
     main="ECDFs for DV (orange) and IV Scores")
  lines(ecdf(iv), col="cyan3", lty="dotted")
Doing a two-sample t test makes the assumption that Likert scores are numerical (not merely ordinal). Among other things that implies it makes sense to sum Likert scores in order to compute sample means. Some researchers make this assumption routinely, and others feel uncomfortable making it.
So doing a t test is somewhat controversial. However, if the assumption is warranted, then there is no question that the t test detects a significant difference in means for my simulated data.
t.test(dv,iv)

         Welch Two Sample t-test

data:  dv and iv
t = 5.0286, df = 200.12, p-value = 1.095e-06
alternative hypothesis: true difference in means is not equal to 0
95 percent confidence interval:
 0.6929647 1.5870353
sample estimates:
mean of x mean of y
     4.70      3.56

