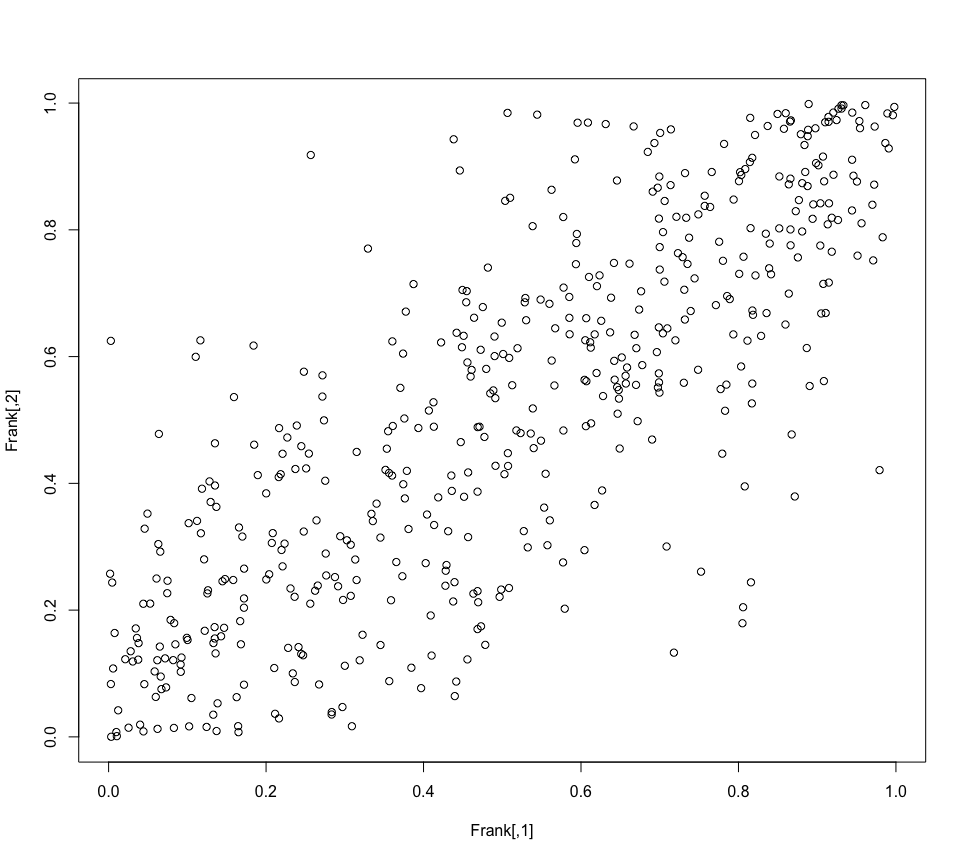
I am reading about Frank copula. From my reading, I found that Frank can model both positive and negative dependency structure between two variables only at the center of the scatter plot. For this part, I found that I can interpret the result as follows:
the relationship between ($X_1$) and ($X_2$) are relative positively (or negatively) at the center and independent at the tails (or extremes values).
However, from the plot of Frank copula, the upper tails are at the top corner (at 1) so, I think should be strong dependency structure.
 Any idea, please?
