8
$\begingroup$

A statistical model is a tuple containing a sample space $S$ and a set of distributions $P$ on that sample space. I'm getting this definition from wikipedia, McCullagh's "What is a Statistical Model", and Wasserman's "All of Statistics".

Suppose we have a dataset of height and age for a bunch of trees, and we want to create a statistical model to predict height from age.

Is the sample space:

  1. $\mathbb{R}$ (the set of possible heights of a tree)
  2. $\mathbb{R}^n$ (the product of the sets of possible heights for each of $n$ trees in our data)
  3. $\mathbb{R^2}$ (the set of possible heights and ages of a tree)

After thinking about it for a while, none of these seem to quite work.

(1) sounds reasonable at first, but it can't possibly be right, because there isn't any mechanism to condition the distribution on age, so basically the best we could do is fit a single distribution to all the heights. Also, this seems to prevent you from defining any model which doesn't assume i.i.d. data.

(2) solves these problems, as you could define a full joint distribution on all the heights. However it sounds extremely strange because your model is basically "fixed" by the size of the data. If you wanted to add a new data point, or predict height from age of a new tree, you would need to create a whole new model with sample space $\mathbb{R}^{n+1}$ and then "copy" the parameters over, which seems pretty bizzare to me.

Another reason this smells off is that in Larry Wasserman's notes on statistical models and sufficient statistics, he writes that any function of $x_1, ..., x_m ∼ p(x; θ)$ (where $p$ is one element of $P$) is a statistic, such as the median. This strongly implies (1) over (2), because it wouldn't really make sense to sample heights for each of $n$ trees, $m$ different times, and then take the median (what does that even mean?).

(3) this allows us to model the joint distribution of age and height, and then condition on age afterwards, so it seems to solve the problem without getting into the weirdness of (2). However, it's still very strange that we're being forced to model a joint distribution, even if we want a purely discriminative model. I suppose one could simply specify p(height, age) = p(height|age)p(age), then choose literally any distribution for age and ignore it -- but this is hardly sensible.

This is a very basic question, but I've been stuck for a while, so I feel like I must have misunderstood something somewhere..

$\endgroup$
7
  • $\begingroup$ I don't think I agree with your definition of a statistical model. I think of a regression model as specifying how the response distribution is varies with respect to the explanatory variables. In other words, the model species a functional relationship between the x-variables and the possible response distributions, not just an unorganized set of distributions as your definition suggestions. $\endgroup$ Commented Jun 7, 2020 at 6:42
  • $\begingroup$ ... If you think of the space of all multivariate normal distributions on n-vectors ($R^n$), then a linear regression model (with fixed-x) corresponds to a low dimensional (dimension equal to the number of coefficients plus one for the variance) curve in that space. $\endgroup$ Commented Jun 7, 2020 at 6:43
  • 1
    $\begingroup$ Or course you can't even begin to discuss the sample space until you specify the model you plan to use. Will your model be conditional on age, or will age also be modelled as a random variable? These two approaches lead to quite diffferent sample spaces. Also, in your universe, it is possible for height and age to take negative values? BTW, I assume your concern is mathematical rather than practical. Specifying a regression model sample space mathematically is non-trivial (a favourite math expression that means "very hard") but will not in any way help you carry out an applied analysis. $\endgroup$ Commented Jun 7, 2020 at 6:56
  • $\begingroup$ One natural (and correct) answer is "none of the above," because the sample space ought to model trees as directly as possible. Thus, the best candidates for an answer would be sets of trees, whether actual or possible ones (such as trees as they might be found in the future). This approach most clearly distinguishes the concept of sample space from the concept of a random variable. See stats.stackexchange.com/a/54894/919 for an extended discussion. $\endgroup$
    – whuber
    Commented Jun 7, 2020 at 15:24
  • 1
    $\begingroup$ @whuber I did read that answer, but I don't think it unconfuses me -- since a tree is not a mathematical object, to define our sample space we would presumably have to pick out all the attributes of a tree we can observe (let's say height, age, and color), and call any such tuple of attribute values a "tree". But to define a statistical model we now need to pick a set of probability distribution on trees, so if we don't care about color, it seems we should just remove that from our list of attributes, to avoid overcomplicating our distributions. -- $\endgroup$
    – shimao
    Commented Jun 7, 2020 at 16:38

3 Answers 3

4
$\begingroup$

To begin with, the statistical model is a triple $(\Omega,\mathcal{F},P)$, where $\Omega$ is the sample space, $\mathcal{F}$ is a sigma-algebra of subsets of $\Omega$ and $P$ is a family of probability distributions that can be indexed by a parameter $\theta$.

To make things clear, let's understand why we need all of these things. $\Omega$ tells us all the possibilities that each realization of a random experiment can take. In you case, each individual unit (a tree) takes a pair of values $(age,height)$. And the space where this pair has possible values is $\mathbb{R}^2$. So suppose you have data on a set of $n$ trees, $X_1,...,X_n$. Each individual $X_i=(age_i,height_i)\in\mathbb{R}^2 \implies (X_1,...,X_n)\in\mathbb{R}^{2n}$.

The second element of the statistical model is a sigma algebra of subsets of $\Omega$, which lists all subsets of our sample space that were interested in measuring probability. For example, we might me interested in measusing the probability that $X_i=(age_i,height_i)\in[10,20]\times[5,10]$, that is the probability that a particular individual tree has age between 10 and 20 and height between 5 and 10m. For continuous values, the common-sigma algebra that we're used to take is the Borel sigma algebra of $\mathbb{R}^n$.

For discrete data it is easier to grasp the idea of what the sigma algebra contains. Let's take as an example an experiment of running a 6-sided dice. In this case $\Omega=\{1,2,3,4,5,6\}$, because each realization of the experiment can only assume on of these values. But we're interested in measuring probability in subsets of $\Omega$. For example, take $A=\{1,2,3\}\subseteq\Omega$. We might be interested in knowing $P(A)$, the probability that a particular realization of the experiment takes a value in $A$. In other words, the probability that the dice returns 1,2 or 3. Also, note that we can be interested in the probability of the complement of $A, A^C=\{4,5,6\}$, or over a union or intersection of sets contained in $\Omega$.

Finally, $P$, the family of probability distributions is a set from which we might choose a particular distribution indexed by a parameter, and this particular distribution fits better the observed data of the experiment by some criteria, for example, a Maximum Likelihood estimate or a regression.

In your problem, you're trying to explain height based on age. That means you're trying to find the density function that better describes height, in practical terms you have a family of distributions $\{f_{\theta}(height),\theta\in\Theta\}$ and you're trying to find which $\theta$ gives you the best fit for height, and the criteria to choose this $\theta$ is the regression you're trying to run. Age is being used as a mean to find the best distribution for height. In this case, we take age as given, not as a random variable.

I think the answer would be something along the lines of: $\Omega=\mathbb{R}^n,\mathcal{F}=\mathbb{B}(\mathbb{R}^n),P=\{f_{\theta,age}(height),\theta\in\Theta\}$

If you were trying to find a joint density for height and age or something like this, then, you would be dealing with a statistical model whose sample space is $\mathbb{R}^{2n}$ because you'd be treating both variables as random. That means, you might have the same data, but depending on what you're doing, the statistical model of interest can change.

If something is wrong, constructive comments are welcome

$\endgroup$
1
  • 3
    $\begingroup$ "to make things clear" should never precede measure theory talk $\endgroup$
    – carlo
    Commented Jun 7, 2020 at 9:29
1
$\begingroup$

I'll keep it as simple as I can. The sample space depends on your sampling method, but in your case, it is probably $\mathbb R^n$. Let's see how else could it be:

  • Let's say you decide to sample $n$ trees (it's not really relevant where and how) and measure their age and height. In that case, the sample you gather ranges on the space $\mathbb R^{2n}$. Since you decided the sample size beforehand, that's indeed the sample space dimensionality.
  • Let's say you go for another fancier sampling method: you keep gathering data until you find a tree higher than 10 meters. You can absolutely do that. Of course the sample space has not fixed dimensionality anymore, you simply can't express it anymore unless you resort to more complex mathematical constructions. You may say that it is $\mathbb R^\infty$, but that is not really accurate.
  • Let's now drop this overly complicate case, and think to a more useful example: you sample a fixed number $n$ of trees of some given ages of interest to you (or you may grow them for a fixed time span) and then you measure the height. Age is not random, it depends on your experiment design, so age is not really sampled. Sample space is $\mathbb R^n$.
  • Anyway, more often than not, in observational studies where you don't decide covariates in advance, but you aim to build a regression model, statisticians condition the sample and the model on the values of the covariates. I think I understand that you have a model where the height is the target variable and the age is the covariate, in that case you condition everything on the observed ages and when you condition something on something else, the second thing is not random anymore, even if it has been sampled like in the first bullet above. That's why your sample space from $\mathbb R^{2n}$ becomes $\mathbb R^n$. This has some useful theoretical consequences (and some bad ones too, to be fair), and this is the reason for which books tend to represent this way sample spaces in case of regression models, but it does depend on the book.

The others who commented raised the concern that you may decide to use $\mathbb R^+$ instead of $\mathbb R$, and more importantly, that your definition of a statistical model is both a little reductive and not very useful. In any case, I hope I helped you to understand what the sample space is.

$\endgroup$
1
$\begingroup$

A sample space is a set of all possible outcomes of a random experiment. An event is a subset of the sample space. A probability function takes an event as input, and outputs a real number between 0 and 1 (probability).

A stochastic model captures our understanding of the random experiment. In order to summarize all possible ways to choose the outcome (age, height) of a stochastic model, with different probabilities, a distribution is used. This distribution (or likelihood) typically involves some unknown parameters (such as the slope of age vs height, and the height-intercept bias) that are inferred using statistical inference. Each possible parameter setting gives rise to a different stochastic model. The collection of all such stochastic models is usually referred to as a statistical model. So, a statistical model with unknown parameters becomes a stochastic model with inferred parameters.

The stochastic model on the tree dataset will be the age on x-axis, height on y-axis, and probability on z-axis. That makes the sample space R^2, with the z-axis being the probability distribution (topology) on that sample space. The task of inferring/learning the unknown parameter (say, using gradient descent) is called Inference.

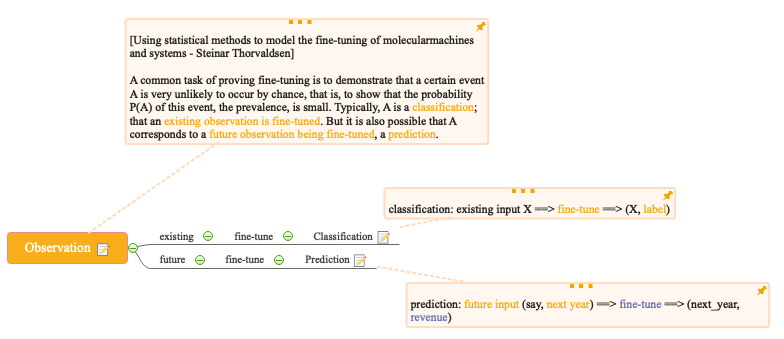
Guessing the height given the age is called prediction. It is a kind of fine-tuning where we know the age and we fine-tune it to include height. This is done by passing age to the stochastic model that outputs the height. It falls under the purview of Decision.

Probability

Observation

References:

1 Blitzstein J.K., Hwang J. - Introduction to Probability-CRC (2015)

2 Using statistical methods to model the fine-tuning of molecular machines and systems - Steinar Thorvaldsen

$\endgroup$

Your Answer

By clicking “Post Your Answer”, you agree to our terms of service and acknowledge you have read our privacy policy.

Not the answer you're looking for? Browse other questions tagged or ask your own question.