4
$\begingroup$

I think this is a simple question, but I'm having difficulty coming up with a test or example for this.

Consider lm(A ~ B*C, data=D) where A is continuous; B and C are Binary; and the assumptions of linear regression are met.

Can a situation exist where neither B nor C significantly affect the slope (0.05 - the coefficient t-tests), but the the interaction term is significant (the coefficient t-test)? What I imagined while brainstorming is the possibility that the interaction could weaken or counteract individual effects.

By situation, I mean realistic populations that give this effect. This means that repeated sampling would predominantly produce this result -- B:C is significant at p=0.05, and both B and C are not. Thus, solutions that play with just crossing the p = 0.05 boundary to get limited "success" a fraction fo the time, or use very small samples, or are based on the degrees of freedom are excluded.

The answer does not have to be coming up with such real-world populations (although that would be great) - a simulation is fine. I find this easy if one factor has 3 levels, but I'm not yet finding a solution for this 2x2 situation.

$\endgroup$
1
  • $\begingroup$ For additional thoughts about how this situation can arise and alternative ways of modeling it, see stats.stackexchange.com/a/5481/919. $\endgroup$
    – whuber
    Commented Aug 27, 2020 at 11:48

2 Answers 2

8
$\begingroup$

For intuition, consider that the $F$ test assesses whether all three variables B, C, and the interaction B:C collectively "explain" the variance of the response, whereas the t-test for any single coefficient considers only that coefficient (after the effects of the other coefficients have been accounted for). The F-test has to account for the presence of B and C along with B:C (and does so by having $3,$ rather than $1,$ numerator degrees of freedom). Therefore, when the true coefficients of B and C are relatively small, it ought to be possible for the situation you describe to hold. In fact, this might even be fairly common.

The intuition suggests a stupid but effective search for an example: create a small dataset with B, C, and B:C variables; use a model in which the only nonzero coefficient is the interaction; add some Gaussian noise; and see what happens. Make a few trials with different variances for the errors, looking for a situation where the p-values aren't extreme: neither very tiny nor too close to $1.$ Then simply keep adding different noise terms to the model until you get an example.

On the third try I found this one with eight (balanced) observations.

Call:
lm(formula = A ~ B * C, data = X)

Coefficients:
            Estimate Std. Error t value Pr(>|t|)  
(Intercept)   0.7597     0.4766   1.594   0.1861  
B            -1.0211     0.6740  -1.515   0.2044  
C            -0.8084     0.6740  -1.199   0.2966  
B:C           3.2233     0.9532   3.381   0.0277 *
---
Signif. codes:  0 ‘***’ 0.001 ‘**’ 0.01 ‘*’ 0.05 ‘.’ 0.1 ‘ ’ 1

Residual standard error: 0.674 on 4 degrees of freedom
Multiple R-squared:  0.7981,    Adjusted R-squared:  0.6466 
F-statistic:  5.27 on 3 and 4 DF,  p-value: 0.07109

There's nothing strange about the data: you can run the code below and plot diagnostics of the model if you like (plot(fit)); they look fine.


Here are the details of the search, performed with R.

X <- expand.grid(B=0:1, C=0:1)
X <- rbind(X, X)                # A small dataset of 8 observations
M <- model.matrix(~ B*C, X)     # Useful for computing predicted values

beta <- c(0,0,0,1)              # The model: only the `B:C` term is nonzero
sigma <- 1                      # The SD of the noise terms

set.seed(17)
n.tries <- 100
for (i in 1:5) {
  X$A <- M %*% beta + rnorm(nrow(X), 0, sigma)
  s <- summary(fit <- lm(A ~ B*C, X))
  p <- coefficients(s)["B:C", 4]
  if (p < 0.05 && 
  pf(s$fstatistic[1], s$fstatistic[2], s$fstatistic[3], lower.tail=FALSE) > 0.05) break
}
if (i < n.tries) print(s) else print("No example found.")
```
$\endgroup$
11
  • 1
    $\begingroup$ One thing I think that's worth noting too is that I always include main effects in my models that must be interpreted when interaction effects are found. After all, in the real world, how can an interaction exist and even enter a model if there are no main effects? $\endgroup$ Commented Aug 23, 2020 at 20:47
  • $\begingroup$ @StatsStudent I have a rough idea of a different type of implementation, more along the lines of temperature and cooking time affecting cookie quality (a Wikipedia example), but also different - my example would be anti-synergistic at the key points where you would expect significance in the individual main effects - but it's still a vague idea. $\endgroup$
    – Davis70
    Commented Aug 23, 2020 at 20:59
  • $\begingroup$ @Dale70, in any event, since you seem to be interested in the interpretation of the effects (or even the interaction), rather than purely predictive modeling, I'd strongly encourage inclusion of any terms that are included in your interactions as this HAS to occur in the real world. $\endgroup$ Commented Aug 23, 2020 at 21:10
  • $\begingroup$ @StatsStudent Though I cannot fault your recommendation for including main effects when looking at interactions, I don't think I's accurate to suggest that main effects must exist when there are interaction effects. For example, imagine a medicine that works for men but not for women. If we code a dummy variable for men as one, then the main effect of treatment is zero and the main effect of the dummy is zero, but the interaction between the two is not. $\endgroup$ Commented Aug 24, 2020 at 8:13
  • 1
    $\begingroup$ @StatsStudent You seem to be confused between the existence of main effects in the data generating process and the finding of significant main effects with a model. There are no main effects in my example, because that is how I specified the data generating process. But if I were to model the data it generated with main effects, those main effects could be significant. Indeed, with an alpha level of 5%, they are significant in 5% of random samples - even though they are not there "in the real world". I hope this clarifies things for you. $\endgroup$ Commented Aug 28, 2020 at 7:25
0
$\begingroup$

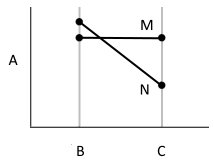
This can occur with a disordinal interaction, AKA a cross-over interaction.

This answer below covers the case where the variables aren't actually "interacting," as the four groups are simple randomly drawn normal distributions, but the interaction term is very significant.

The answer also covers the case of a hypothetical real-world interaction, as it's theoretically possible that a real interaction between B and C could produce this result.

enter image description here

Using the definition of a disordinal interaction, I wrote a script to do a search for a general case that gives B:C being significant, and both B and C being non-significant. (I started with an arbitrary mean of 290, SD of 40.)

The following values, simulated 100 times

  bn <- rnorm(100, 297, 20)  
  cn <- rnorm(100, 283, 20)  
  bm <- rnorm(100, 296, 20)  
  cm <- rnorm(100, 296, 20) 
  Data1$A <- c(bn,bm,cn,cm)  
  bcmn <- lm(A ~ BC*MN, data=Data1) 

gives

"percent success" "85"         
"avg fstatistic"  "12.8511468936879" 
"avg ABB"          "0.52668683272485"  (p-values)
"avg MNN"          "0.442660026410102"
"avg ABB:MNN"      "0.00830151507461766"

Success is all of (ABB:MNN < 0.05; ABB > 0.05; MNN > 0.05). In general, the above pattern returns similar results, where cn is set just below bn, and bm and cm are set 1 to 3 digits below bn.

Reducing the variance to 10 lowers the p-value of ABB:MNN to "4.906e-06" and the other results are very similar. Further reduction of the variance begins to hurt the success rate. Increasing the variance above 20 begins to hurt the success rate.

Data1 is formatted

A           BC    MN  
--          --    --
297.0180     B    M
303.9832     B    M

This post set me in the right direction: https://www.theanalysisfactor.com/interactions-main-effects-not-significant/

$\endgroup$
0

Your Answer

By clicking “Post Your Answer”, you agree to our terms of service and acknowledge you have read our privacy policy.

Not the answer you're looking for? Browse other questions tagged or ask your own question.