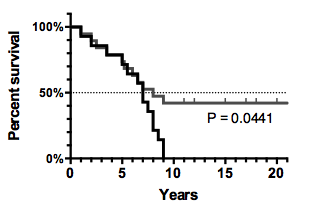
The p-value to which you are referring is result of the log-rank test or possibly the Wilcoxon. This test compares expected to observed failures at each failure time in both treatment and control arms. It is a test of the entire distribution of failure times, not just the median. The null hypothesis for the log-rank test for censured survival data is that the time-averaged hazard ratio for failure comparing treatment and control arms is 1.
It's worth mentioning that the power of this test isn't driven by the number of individuals at-risk in the various treatment arms or strata, but the number of failures observed. So, even if you have two fold sample size in one stratum, if many are censored before a failure is observed, it's not bizarre to see greater power in the other stratum --even if the KM curves look identical-- due to a larger number of failures.
If we reject the null hypothesis and find that subgroup2 has a significant difference in survival comparing treatment to control but subgroup1 does not have such a difference, then there is evidence of effect modification of treatment by subgroup. That suggests there is a difference in survival among those in subgroup2 but not subgroup1. As a sensitivity analysis, it would be useful to display the Kaplan Meier curves and possibly a smoothed estimate of the hazard ratio as a function of time. My guess is that, while the survival may be comparable in the median, it is the sequence of events in the first quartile of failure times that drives much of the inference and you see a quick drop-off in survival in one of the treatment arms for subgroup 2.

