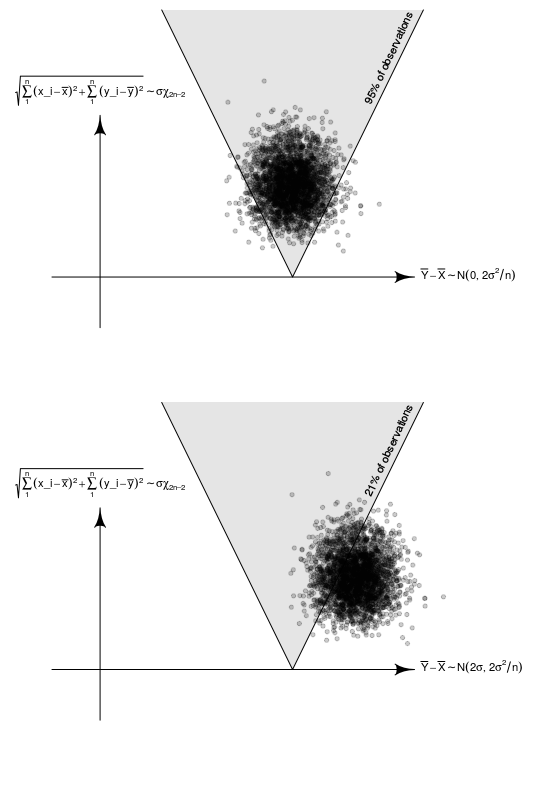
Below is a geometric view of the $t$-test (a similar view is also expressed here).
The $t$-statistic, which is a ratio of the sample mean and the sample standard deviation, follows a ratio distribution, which is when properly scaled the t-distribution.
$$T \sim \frac{Z+\mu}{\sqrt{V_\nu/\nu}} \sim \text{t-distribution with $\nu$ degrees of freedom} $$
where $Z \sim N(0,1)$ is standard normal distributed, $V_\nu \sim \chi^2_\nu$ is $\chi^2$-distributed with $\nu$ degrees of freedom, and $\mu$ is a non-centrality parameter.

In the image above we plotted simulations sample $X$ and $Y$ with sample size $n=5$.
- On the x-axis is the difference in the sample means. The distribution is $$\bar{y}-\bar{x} \sim N(\mu_{Y}-\mu_{X}, \frac{2}{n} \sigma^2)$$
- On the y-axis is the pooled variance. The distribution is $$\sqrt{\sum_{i=1}^n (x_i-\bar{x})^2+\sum_{i=1}^n (y_i-\bar{y})^2} \sim \sigma \chi_{2n-2}$$ where $\sigma \chi_{2n-2}$ is a scaled $\chi_{2n-2}$ distribution.
Both the 'difference in the sample means' and the 'pooled variance' relate to the unknown deviation parameter $\sigma$ which is a nuisance parameter. But, their ratio does not depend on $\sigma$, and that is how we can perform a $t$-test. The ratio, the t-statistic (note we apply scaling to the numerator and denominator), follows a t-distribution.
$$\begin{array}{rcl}T &= & \frac{1/(\sqrt{2/n})}{1/\sqrt{2n-2}} \frac{\bar{y}-\bar{x}}{\sqrt{\sum_{i=1}^n (x_i-\bar{x})^2+\sum_{i=1}^n (y_i-\bar{y})^2}}\\
& \sim& \frac{Z}{\sqrt{V_\nu/\nu}} \\&\sim &\text{t-distribution with $\nu$ degrees of freedom} \hphantom{\text{and noncentrality parameter $\frac{\sqrt{2n-2}}{\sqrt{2/n}}$ }} \end{array}$$
In the lower image we showed how the distribution will look like when the difference $\mu_{y'}-\mu_{x'} \neq 0$ and would be shifted by $c=2$ standard deviations. We can express the t-statiatic like above by comparing variables $Y'$ and $X'$ which have a different mean to variables $Y$ and $X$ which have the same mean. Then there will be an extra term in the numerator. The distribution of the t-statistic would become
$$\begin{array}{rcl}T' &= & \frac{1/(\sqrt{2/n})}{1/\sqrt{2n-2}} \frac{\bar{y}'-\bar{x}'}{\sqrt{\sum_{i=1}^n (x_i'-\bar{x}')^2+\sum_{i=1}^n (y_i'-\bar{y}')^2}}\\
&= & \frac{1/(\sqrt{2/n})}{1/\sqrt{2n-2}} \frac{\bar{y}-\bar{x}+ c\sigma}{\sqrt{\sum_{i=1}^n (x_i-\bar{x})^2+\sum_{i=1}^n (y_i-\bar{y})^2}}\\
& \sim& \frac{Z+c \frac{1}{\sqrt{2/n}} }{\sqrt{V_\nu/\nu}} \\&\sim &\text{t-distribution with $\nu$ degrees of freedom and noncentrality parameter $\frac{c}{\sqrt{2/n}}$ } \end{array}$$
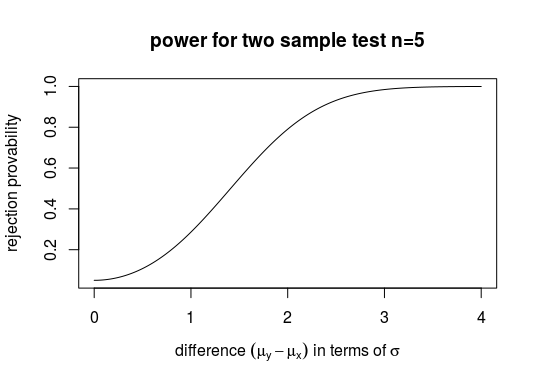
So the power for a 95% confidence interval can be expressed in terms of the shift in standard deviations:

You do not know the standard deviation, so you can not express the power in terms of the effect size in absolute terms, but you can express the power in terms of the relative effect size (relative to the standard deviation).
You can generalize this result for different sample sizes, but not for different populations variances (which is the Behrens Fisher problem)


