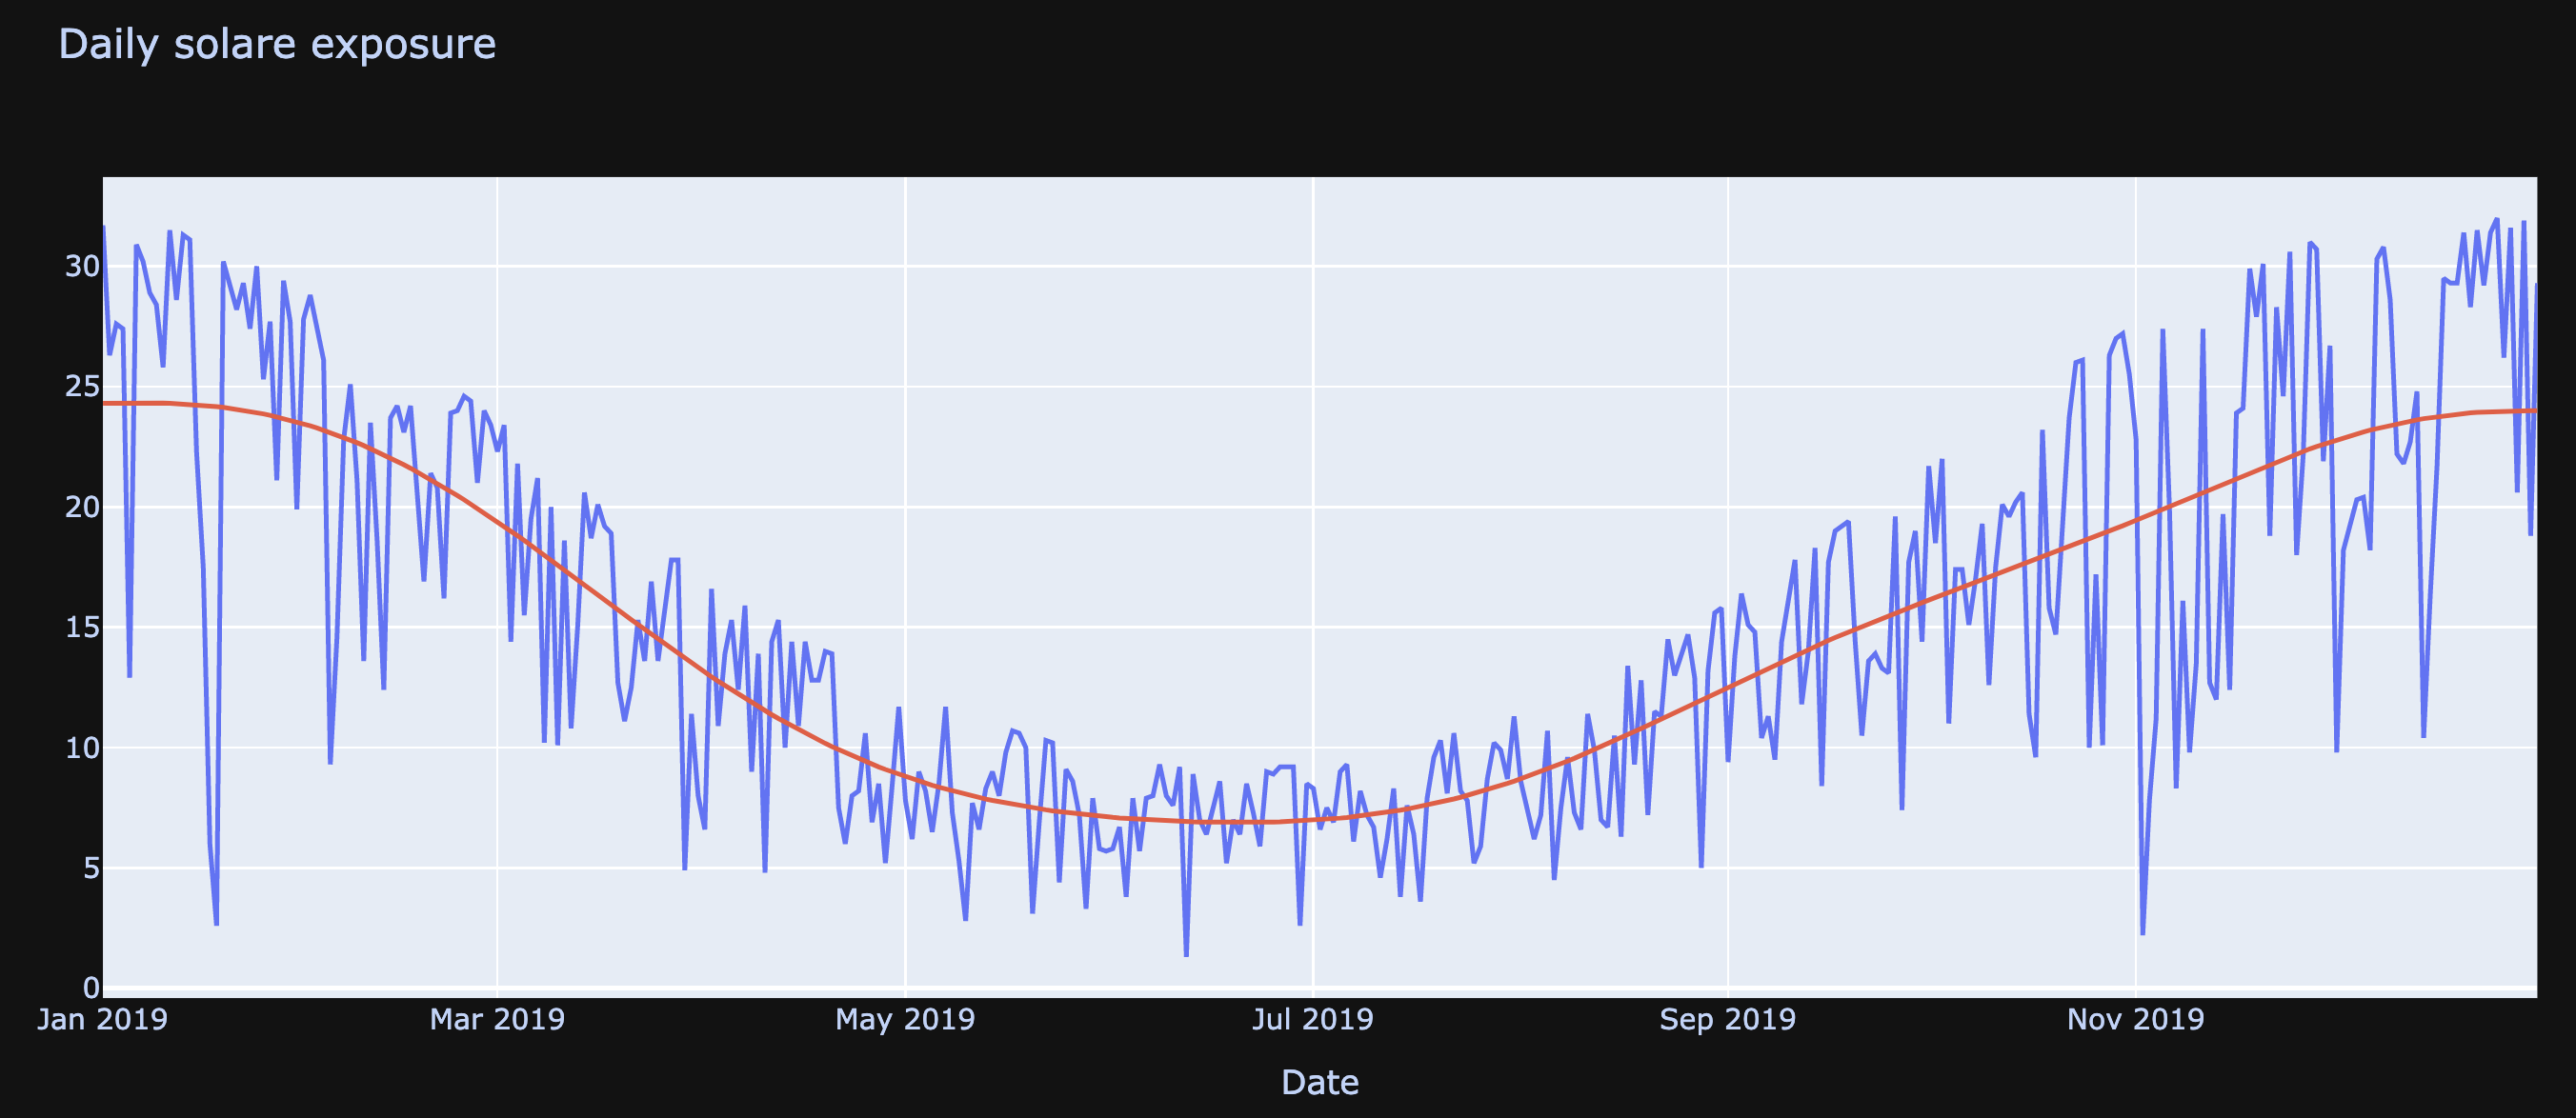
I have a dataset that I'd like to remove noise from. All the noise is subtractive, so the ideal value would always be greater than or equal to the measured value.
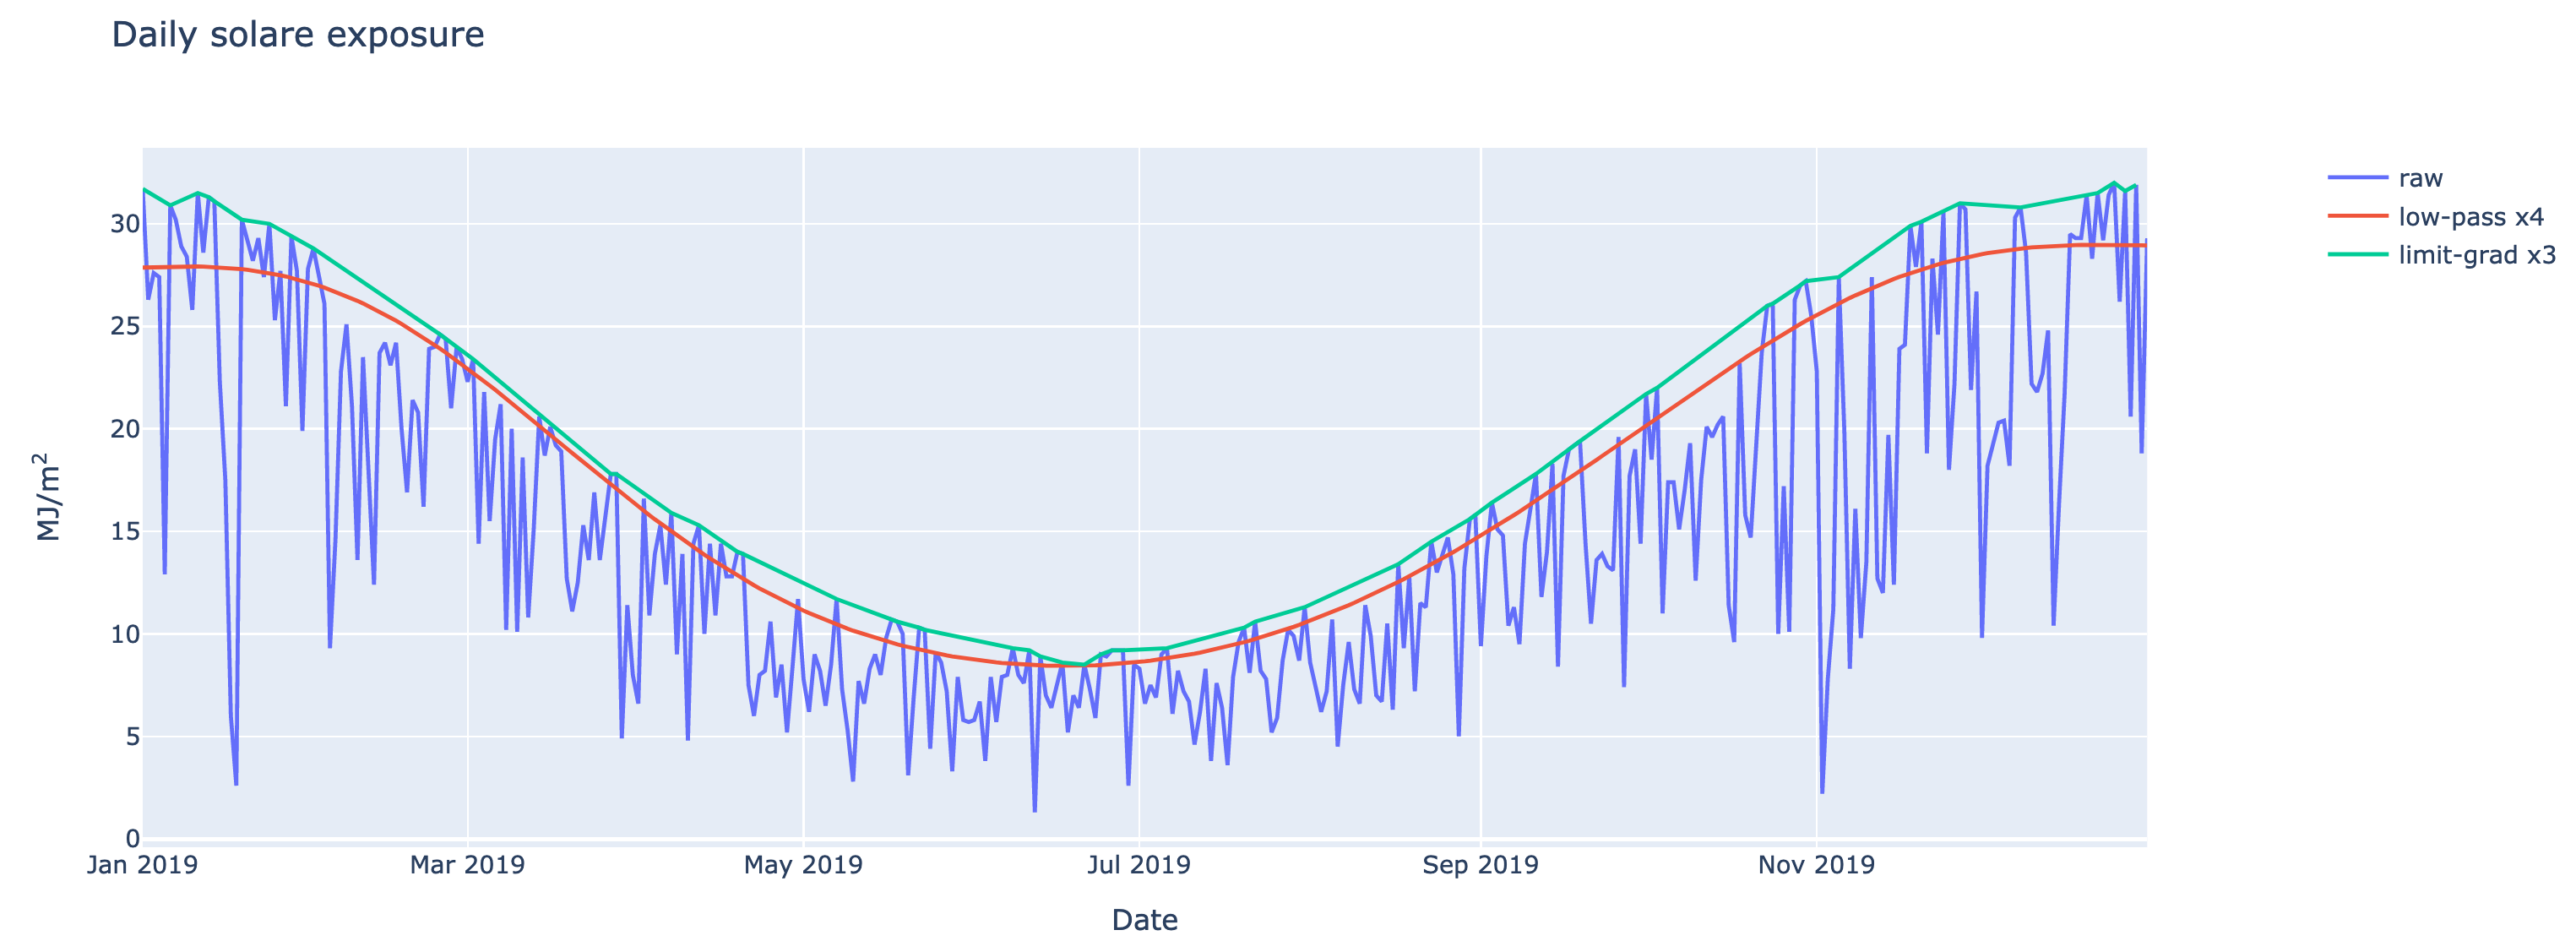
The following chart shows the raw data (blue) and the same data after a low-pass filter (red).
But I want to fit the red curve to the top of the signal, not to the middle. Imagine draping a string with a certain stiffness over the top of the chart, so it rests on the local maxima without dipping down into the troughs. I also want to ensure the curve doesn't sit too far above the true signal.
Some ideas:
- Apply the low-pass filter and remove values lower than the resulting curve, and repeat a few times.
- Remove points that have large negative gradients, and repeat a few times.
Are there well-known methods or functions for finding the upper envelope?


