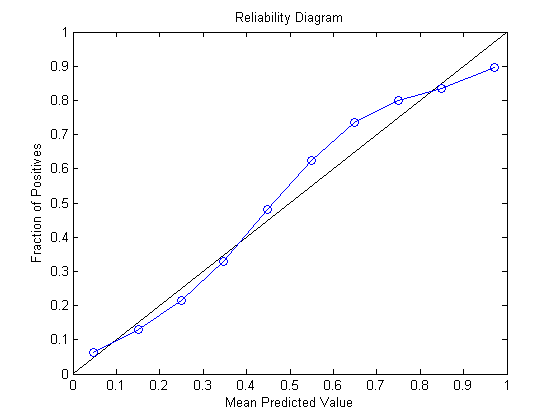
When using calibrators (e.g. Platt Scaling, Isotonic Regression) to get better calibrated probabilities from our classifiers, we are effectively finding a mapping from the output scores of the classifier to the well-calibrated probability for that score. In other words, we want to find a function approximating the curve on the reliability diagram, like the one below that I took from MathWorks' website.
If I think of this as a regression problem, it would have the classifier scores as the x values, and the actual fractions of positives as the y values.
I understand we cannot actually use these fractions of positives due to not having an infinite amount of data, but instead we fit the calibrator using the original 0/1 training labels (or a separated batch to avoid bias). My question is why does this give us the curve we want, when these labels are seemingly very different from the fractions of positives in the reliability diagram?

