Solving problems like this has to be done in two parts:
Determine an optimal procedure for deciding which color is the majority.
Assess the risk of that procedure as it depends on the sample size.
The "risk," as you have framed it, is the chance of being wrong. It sounds you would like to limit this chance to $\alpha=5\%$ or less.
Fortunately, an intuitively obvious procedure is demonstrably optimal: whatever color is in the majority in the sample is the one you should identify as being in the majority in the jar. To deal with the possibility of ties (for even-sized samples), let's just ignore the last element of the sample. (Equivalently, choose one of the sampled balls at random and throw it back into the jar!) Thus we will say the "majority color" in the sample is the color that appears more often in the sample and we may as well assume the sample size is odd.
Generally, then, your underlying mathematical problem is the following:
A jar contains balls of two colors in quantities $K \gt M;$ the sum $N=K+M$ is known. A random sample is taken (without replacement) and in it are found $k$ balls of one color and $m\le k$ of another (with $m$ possibly equal to zero). What is the chance that the majority color in the sample is not the majority color in the jar?
Once the answer to this question is found, then given an acceptable risk $\alpha$ we simply need to find the smallest (odd) value of $n=m+k$ between $0$ and $N$ that makes this chance less than or equal to $\alpha.$
Let's solve the mathematical problem, then. In a sample of size $n$ from this jar, the chance of observing $k$ majority balls is
$$p(k;n,K,M) = \frac{\binom{K}{k}\binom{M}{n-k}}{\binom{K+M}{n}}.$$
The denominator counts the number of such samples while the numerator counts the samples with $k$ majority and $n-k$ minority balls. Consequently the risk of error (when $n$ is odd) is
$$r(n,K,M) = \sum_{k = 0}^{n/2} p(k;n,K,M).$$
For large values of $n$ this can be evaluated as a hypergeometric function; but for small problems like the ones posed here, we might just as well have a computer evaluate the sum and systematically search for the best $n.$
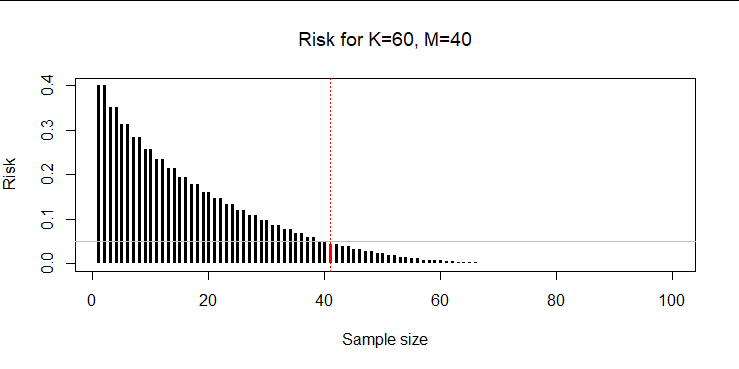
Here is a plot of the risks for a jar with $K=60$ and $M=40$ marbles:

The smallest sample size with a risk less than $\alpha=5\%$ is $n=41,$ shown in red. The risk declines almost exponentially with sample size over a wide range. Provided $K$ and $M$ are not too close to one another, this tends to be the case and helps expedite the search for the optimal sample size. ("Too close" when $\alpha=5\%$ means their difference is less than twice the square root of their sum.)
For the problem with $K=75$ and $M=25,$ the smallest sample size that works is $9,$ with a risk of $4.1\%.$
For the problem with $K=51$ and $M=49,$ this approach gives a sample size of $99,$ with a risk of $0\%.$
This code (written in R) implements the functions $p$ and $r$ and creates the plot.
p <- function(k,n,K,M) {
  exp(lchoose(K,k) + lchoose(M,n-k) - lchoose(K+M,n))
}
risk <- Vectorize(function(n,K,M) {
  sum(p(seq(n/2+1)-1, n, K, M)) + ifelse(n %% 2 == 0, -p(n/2, n, K, M)/2, 0)
}, "n")
#
# Do an example and plot it.
#
alpha <- 5/100
K <- 60
M <- 40

n <- seq(1, K+M, by=1)          # Set of trial sample sizes
x <- risk(n, K, M)              # Their risks
n.star <- which.max(x <= alpha) # Index of the best risk; n[n.star] is the answer

plot(n, x, type="h", ylim=c(0, max(x)),
     xlab="Sample size", ylab="Risk",
     lwd=3, lend=1, col=c(rep("Black", n.star-1), "Red", rep("Black", length(x)-n.star)))
abline(h=alpha, col="Gray")
abline(v=n[n.star], col="Red", lty=3)

