18
$\begingroup$

Is there a "rule" to determine the minimum sample size required for a t-test to be valid?

For example, a comparison needs to be performed between the means of 2 populations. There are 7 data points from one population and only 2 data points from the other. Unfortunately, the experiment is very expensive and time consuming, and obtaining more data is not feasible.

Can a t-test be used? Why or why not? Please provide details (the population variances and distributions are not known). If a t-test can not be used, can a non parametric test (Mann Whitney) be used? Why or why not?

$\endgroup$
2

8 Answers 8

9
$\begingroup$

I'd recommend using the non-parametric Mann-Whitney U test rather than an unpaired t-test here.

There's no absolute minimum sample size for the t-test, but as the sample sizes get smaller, the test becomes more sensitive to the assumption that both samples are drawn from populations with a normal distribution. With samples this small, especially with one sample of only two, you'd need to be very sure that the population distributions were normal -- and that has to be based on external knowledge, as such small samples gives very little information in themselves about the normality or otherwise of their distributions. But you say that "the population variances and distributions are not known" (my italics).

The Mann-Whitney U test does not require any assumptions about the parametric form of the distributions, requiring only the assumption that the distributions of the two groups are the same under the null hypothesis.

$\endgroup$
4
  • 7
    $\begingroup$ Not a good recommendation for extremely small sample sizes. With 7 and 2 samples, the U-test will fail, no matter how large the difference between the mean of the groups. Look at my answer for an example. $\endgroup$
    – AlefSin
    Commented Jan 13, 2014 at 11:14
  • 3
    $\begingroup$ I would second what @AlefSin says. If it is important for you to draw valid conclusions (and not only get a p-value) then the more resonable assumptions you can make the better. If there is reasonable background information you could also add even more assumptions if you did your analysis in a Bayesian framework. $\endgroup$ Commented Jan 29, 2014 at 16:09
  • 2
    $\begingroup$ One problem is that with such small sample sizes, the Wilcoxon-Mann-Whitney cannot achieve typical significance levels. With sample sizes of 7 and 2 you'll never get a result significant at the 5% level, no matter how blatant the difference. Consider (1.018,1.031,1.027,1.020,1.021,1.019,1.024) vs (713.2, 714.5) -- not significant at the 5% level! $\endgroup$
    – Glen_b
    Commented Mar 30, 2014 at 23:59
  • 3
    $\begingroup$ That said, if one has $n_1=7$ and $n_2=2$, there's a very good argument that one should perhaps consider whether a 5% test makes sense in the first place. A proper assessment of the cost of the two error types may lead to quite a different choice. $\endgroup$
    – Glen_b
    Commented Apr 2, 2015 at 5:53
7
$\begingroup$

(disclaimer: I cannot type well today: my right hand is fractured!)

Contrary to the advice to use a non-parametric test in other answers, you should consider that for extremely small sample sizes those methods are not very useful. It is easy to understand why: in studies with extremely small size, no difference between groups can be established unless a big effect size if observed. Non-parametric methods, however, do not care for the magnitude of the difference between the groups. Thus even if the difference between the two groups is huge, with a tiny sample size a non-parametric test will always fail to reject the null hypothesis.

Consider this example: two groups, normal distribution, same variance. Group 1: average 1.0, 7 samples. Group 2: average 5, 2 samples. There is a big difference between the averages.

wilcox.test(rnorm(7, 1), rnorm(2, 5))

   Wilcoxon rank sum test

data:  rnorm(7, 1) and rnorm(2, 5)
W = 0, p-value = 0.05556

The computed p-value is 0.05556 which does not reject the null hypothesis (at 0.05). Now, even if you increase the distance between the two means by a factor of 10, you will get the same p-value:

wilcox.test(rnorm(7, 1), rnorm(2, 50))

   Wilcoxon rank sum test

data:  rnorm(7, 1) and rnorm(2, 50)
W = 0, p-value = 0.05556

Now I invite you to repeat the same simulation with t-test and observe the p-values in the case of large (average 5 vs 1) and huge (average 50 vs 1) differences.

$\endgroup$
6
$\begingroup$

There is no minimum sample size for a t-test; the t-test was, in fact, designed for small samples. In the old days when tables were printed, you saw t-test tables for very small samples (as measured by df).

Of course, as with other tests, if there is a small sample only quite a large effect will be statistically significant.

$\endgroup$
4
  • 1
    $\begingroup$ But will the opposite also be a problem? I.e., might outliers that happened to be sampled lead to falsely rejecting the null hypothesis? Or is low power to detect differences a bigger problem? In this particular situation I am seeing a significant difference between the means but don't know how much to "trust" it. $\endgroup$ Commented Jan 21, 2012 at 23:09
  • 3
    $\begingroup$ With n=2 you are definitely vulnerable to the influence of outliers--outliers in the population; how can a sample of 2 have an outlier within the sample? :-) I wouldn't try any inferential statistics in this situation. Prospects are poor for getting at the "truth," and you'll be leaving yourself wide open to criticism. $\endgroup$
    – rolando2
    Commented Jan 22, 2012 at 0:23
  • 2
    $\begingroup$ The reason that the confidence interval will be wide is precisely because you might get an outlier. But t-test still assumes samples are from a normal population. $\endgroup$
    – Peter Flom
    Commented Jan 22, 2012 at 1:54
  • $\begingroup$ "There is no minimum sample size for a t-test" Do you mean, by this, that the minimum sample size is 1? $\endgroup$
    – Him
    Commented May 31, 2020 at 20:52
3
$\begingroup$

I assume you mean you have 7 data points from one group, and 2 data points from a second group, both of which are subsets of populations (e.g. subset of males and subset of females).

The maths for the t-test can be obtained from this Wikipedia page. We will assume an independent two-sample t-test, with unequal sample sizes (7 vs. 2) and unequal variances, so about half-way down that page. You can see that the calculation is based on means and standard deviations. With only 7 subjects in one group and 2 subjects in another, you cannot assume you have good estimates for either the mean or the standard deviation. For the group with 2 subjects, the mean is simply the value that lies exactly in the middle of the two data points, so it is not well estimated. For the group with 7 subjects, sample size strongly affects variances (and therefore standard deviations, which are the square root of the variance) because extreme values exert a much stronger effect when you have a smaller sample.

For example, if you look at the basic example on the Wikipedia page for standard deviation you will see that the standard deviation is 2, and the variance (square the standard deviation) is therefore 4. But if we only had the first two data points (the 9 and the 1), the variance would be 10/2 = 5 and the standard deviation would be 2.2 and if we only had the last two values (the 4 and the 16), the variance would be 20/2 = 10 and the standard deviation would be 3.2. We're still using the same values, just less of them, and we can see the effect on our estimates.

That is the problem with using inferential statistics with small sample sizes, your results will be particularly strongly affected by sampling.

Update: is there any reason why you can't simply report the results by subject and indicate that this is exploratory work? With only two cases, the data is very similar to a case study, and these are both (1) important to write up and (2) accepted practice.

$\endgroup$
5
  • $\begingroup$ Thanks Michelle. This is interesting and useful to know. However, what would you recommend from a practical point of view? Given this situation, what is the best way to proceed? Thanks! $\endgroup$ Commented Jan 21, 2012 at 23:05
  • $\begingroup$ Hi Johnny Puzzled. Without more information on your exact situation I feel unable to give more guidance. $\endgroup$
    – Michelle
    Commented Jan 21, 2012 at 23:35
  • $\begingroup$ What kind of information is needed? $\endgroup$ Commented Jan 21, 2012 at 23:44
  • 1
    $\begingroup$ Hi again, more information on your study design, such as what your data is, how you collected it, what your groups are, how the observations were selected. All I know is that you did an experiment with 9 observations (people? rats? neurons? blocks of cheese? radiation frequencies?) that are from two groups. $\endgroup$
    – Michelle
    Commented Jan 21, 2012 at 23:59
  • $\begingroup$ Let's say that the average blood flow to white matter in the brain was measured in humans using MRI. The groups are controls (7 people) and age/sex matched patients with a particular disorder (2 people). $\endgroup$ Commented Jan 22, 2012 at 12:35
1
$\begingroup$

Interesting related article: 'Using the Student's t-test with extremely low samlpe sizes' J.C.F de Winter (in Practical Assesment, Research & Evaluation) http://goo.gl/ZAUmGW

$\endgroup$
0
$\begingroup$

I would recommend to compare the conclusions that you get with both, the t-test and the Mann-Whitney test, and also take a look at boxplots and the profile likelihood of the mean of each population.

$\endgroup$
1
  • $\begingroup$ Hi @Demian, I'm not sure that even a boxplot will be helpful when one group has a sample size of 2. Otherwise, yes I think boxplots in particular are very helpful in visualising continuous data across groups. $\endgroup$
    – Michelle
    Commented Jan 22, 2012 at 22:54
0
$\begingroup$

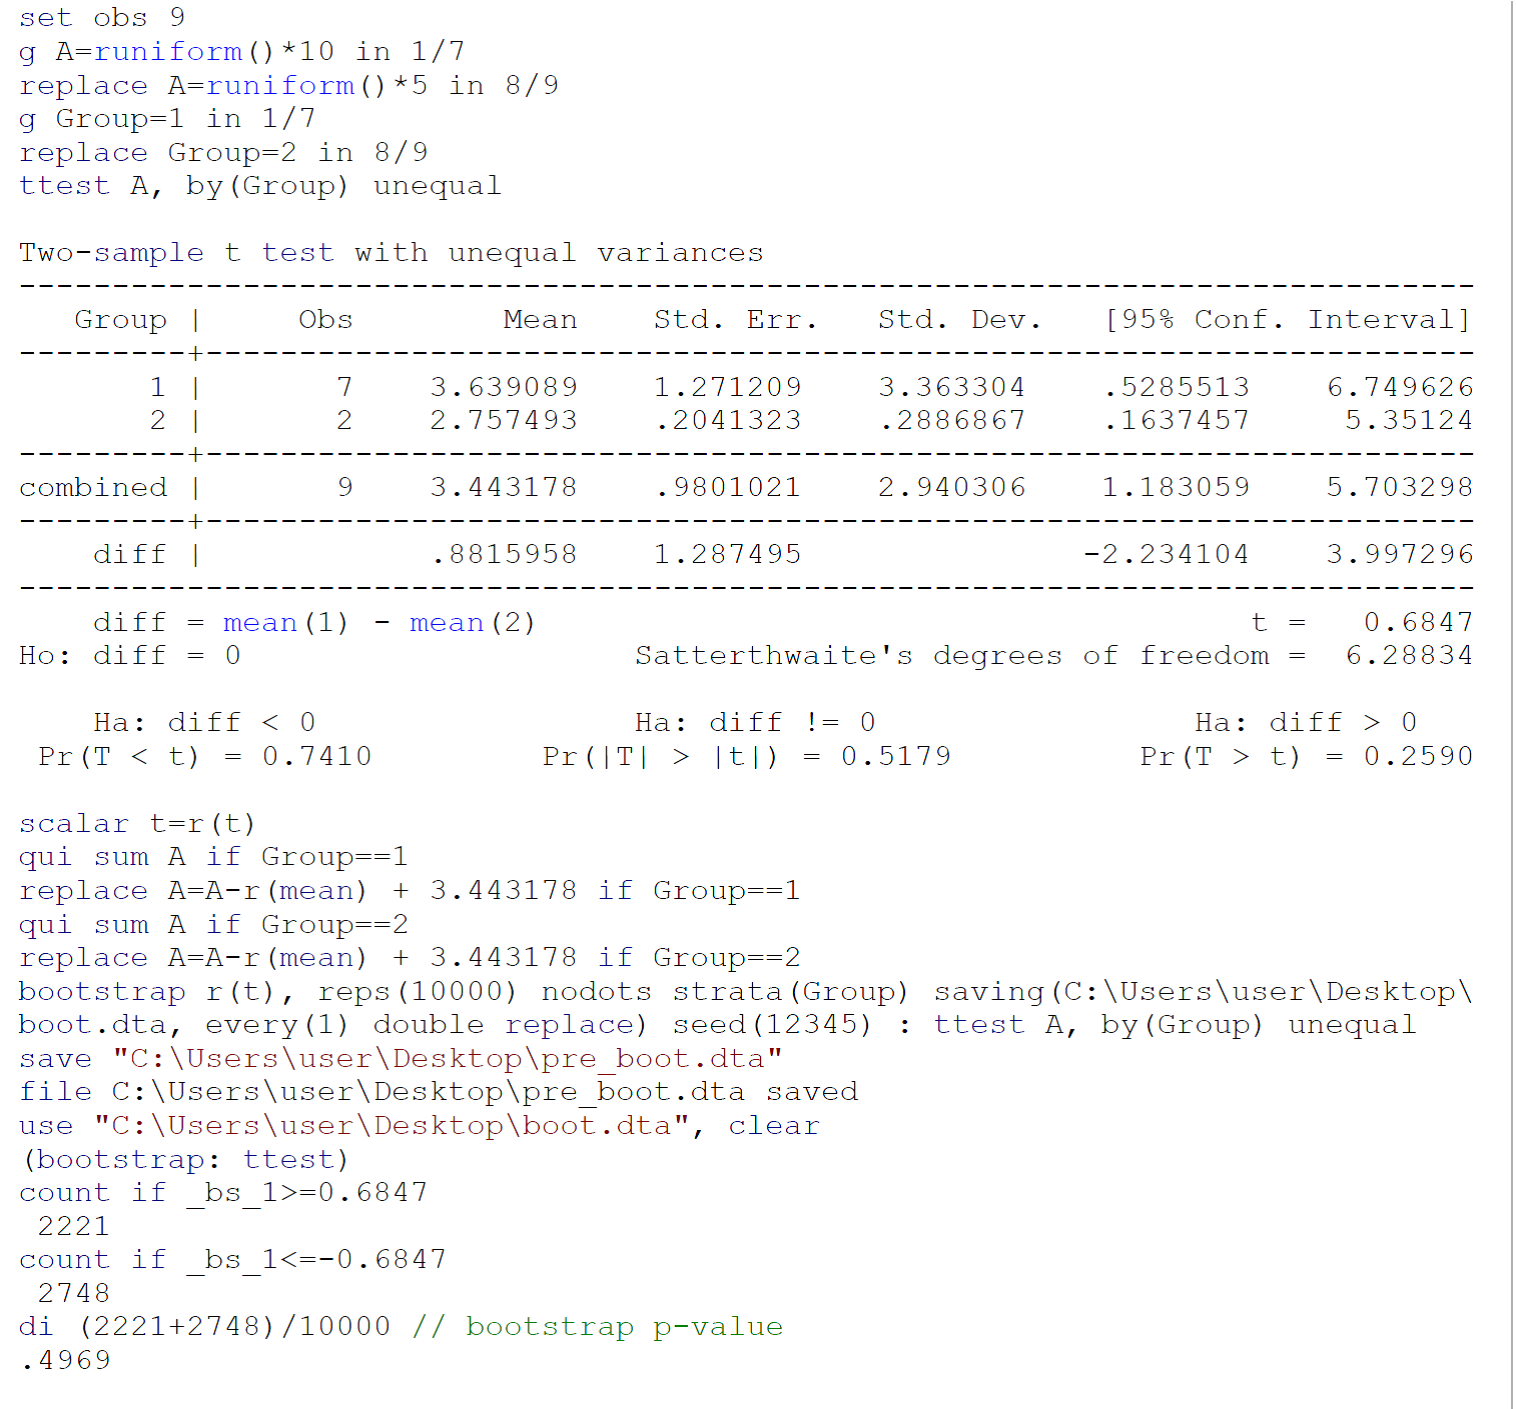
Stata 13/SE code for a bootstrap ttestAs a ttest performed on small samples probably does not fulfill the ttest requirements (mainly, the normality of the populations from which the two samples have bee drawn), I would recommend to perform a bootstrap ttest (with unequal variances), following Efron B, Tibshirani Rj. An Introdution to the Bootstrap. Boca Raton, FL: Chapman & Hall/CRC, 1993: 220-224. The code for a bootstrap ttest on the data provided by Johnny Puzzled in Stata 13/SE is reported in the image above.

$\endgroup$
2
  • $\begingroup$ Your answer has serious formatting issues, would you mind editing it? $\endgroup$
    – amoeba
    Commented Jan 29, 2014 at 10:07
  • $\begingroup$ I have tried to solve formatting issues in the reviewed version of the answer. Thanks to amoeba for pointing this out. $\endgroup$ Commented Jan 29, 2014 at 16:01
0
$\begingroup$

With a sample size of 2, the best thing to do may be to look at the individual numbers themselves and not even bother with statistical analysis.

$\endgroup$
1
  • 1
    $\begingroup$ At present this reads more like a comment. While this is a good point, for a reasonable answer to the original problem, some discussion of the issue itself might be expected, even if ultimately one concludes that it makes more sense to do something else. $\endgroup$
    – Glen_b
    Commented Apr 2, 2015 at 5:55

Your Answer

By clicking “Post Your Answer”, you agree to our terms of service and acknowledge you have read our privacy policy.

Not the answer you're looking for? Browse other questions tagged or ask your own question.