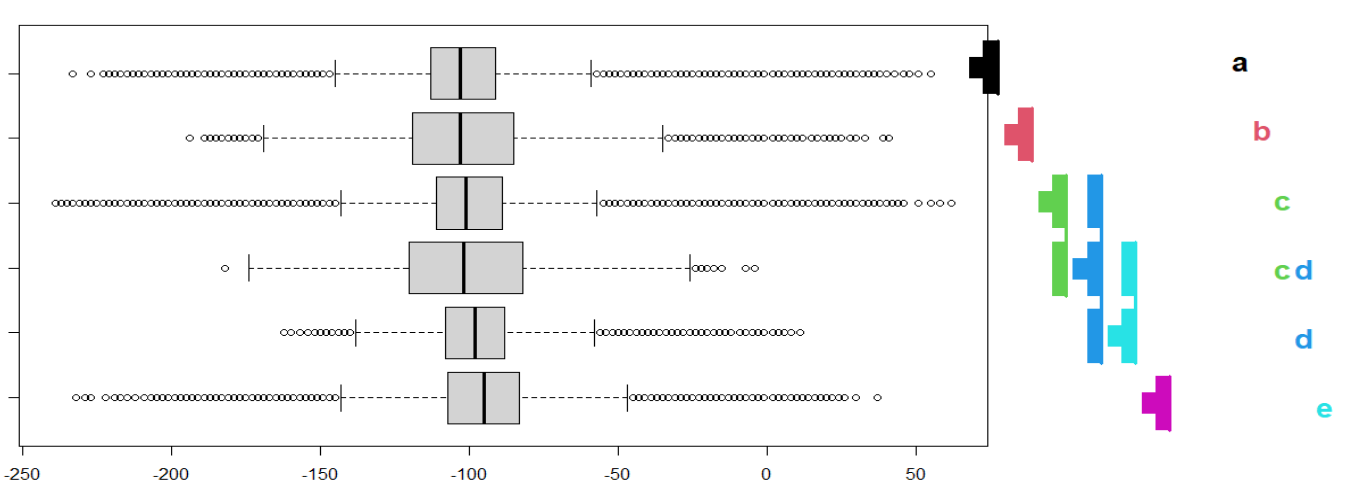
This shows a box plot of value distributions for several variables. I know that the letters indicate plots that are too similar to distinguish at a 95% confidence interval. What do these corresponding colored Ts and bars represent?
-
2$\begingroup$ This very much resemble letter-based displays for post-hoc tests. Which package is this? $\endgroup$– chlCommented Nov 23, 2020 at 19:03
-
$\begingroup$ A is signif less than B, which is signif less than C & D (which cannot be distinguished from one another). Also C & D are signif less than E. $\endgroup$– BruceETCommented Nov 23, 2020 at 19:52
-
$\begingroup$ @chl This is multcompView $\endgroup$– Eric DeutschCommented Nov 23, 2020 at 21:04
1 Answer
Other than the letter-based displays discussed in this related thread, the documentation of the multcompView package (help(multcompTs)) explicitely says that the "T's" are used for
describing the "undifferentiated classes" that identify the other factor levels or items that are not distinct or not significantly different from the "base" of the "T"; if two or more levels have the same pattern of significant differences, the two are combined into one "T" with two "bases".
The accompagnying example might clarify that (1) this display requires a k-by-k matrix, where k is the number of levels of the factor (or of the contrasts of interest), (2) a "T" is always present on the diagonal, (3) a significant result is indicated by the absence of a "T" or its base.
Let's contemplate the online example:
dif4 <- c(.01, .02, .03, 1)
names(dif4) <- c("a-b", "a-c", "b-d", "a-d")
Considering $\alpha = 0.05$, the first three contrasts are significant at that level of significance. This is coded as -1 by the R function below, while 0 is used to denote non-significant difference. Of course, this matrix should be symmetric. Graphically, 0's are replaced with the base of a "T", while -1 are simply not shown. (Don't ask me why.)
> (diff4.T <- multcompTs(dif4))
   a  b  c  d
a  1 -1 -1  0
b -1  1  0 -1
c -1  0  1  0
d  0 -1  0  1

## plot(diff4.T)
In your example, d is different from c and from e. The color simply refers to the (consecutive) level of the factor, using the base R color scheme.

