Normal approximation to binomial test. In order to do a test of binomial proportions one would need
an estimate of the size of the village population, which
presumably has not changed from 2018 to 2019. Just as an experiment let's suppose it is $n = 5000.$ Then we can test the null hypothesis $H_0: p_{18}=p_{19}$ that the proportion of deaths due to the
tiger has not changed by wearing masks, against the alternative
$H_a: p_{18} > p_{19}.$
Then the procedure prop.test in R, which uses a normal approximation, goes as shown below. The null hypothesis is
not rejected (large P-value), so there is no statistically
significant evidence that masks offer protection against
deadly tiger attacks. [The test statistic X-squared is
the square of a normal z-statistic.]
prop.test(c(60, 52), c(5000,5000), alt="less")

        2-sample test for equality of proportions
        with continuity correction

data:  c(60, 52) out of c(5000, 5000)
X-squared = 0.44246, df = 1, p-value = 0.747
alternative hypothesis: less
95 percent confidence interval:
 -1.000000000  0.005261848
sample estimates:
prop 1 prop 2
0.0120 0.0104
Technically speaking, the P-value depends on the population
size assumed for the village, but for reasonable assumptions
the interpretation of the test is the same.
Normal approximation to Poisson test. Suppose the village
rates of tiger deaths in the two years are $\lambda_{18}$ and
$\lambda_{19},$ respectively. Then we can test
$H_0: \lambda_{18}-\lambda_{19}=\delta=0$ against the alternative
$H_0: \lambda_{18}-\lambda_{19}=\delta>0.$ In this formulation,
we estimate $\delta$ by $\hat\delta = X - Y = 60-52 = 8.$
Then, under $H_0,$ we have $E(\hat \delta) = 0,$
$Var(\hat\delta) = 120,$ and $SD(\hat\delta) = \sqrt{120} = 10.95.$
The z-statistic
$Z = (\hat\delta-\delta)/SD(\hat\delta) = 8/10.95 = 0.79 < 2.573,$ where $2.576$ cuts probability 5% from the upper tail of a standard normal distribution. Thus $H_0$ is not rejected.
Also, the P-value is $P(Z > 0.79|H_0) = 0.2148 > 0.05.$
1-pnorm(0.79)
[1] 0.2147639
Parametric bootstrap one-sided confidence interval for $\delta.$
For $\lambda$ as small as $60.$ one may question whether the
normal approximation gives reasonable P-values. A parametric
bootstrap procedure estimates the distribution of $\hat\delta$
by taking repeated samples of $\hat\delta$ from distributions
suggested by the data. We use $B = 10,000$ such re-sampled estimates
$\hat \delta,$ called Del in the R code below.
del.obs = 8
set.seed(1226)
x = rpois(10^4, 60);  y = rpois(10^5, 52)
Del = x - y
summary(Del)
   Min. 1st Qu.  Median    Mean 3rd Qu.    Max.
 -49.00    1.00    8.00    8.01   15.00   57.00
quantile(Del, .95)
95%
 25
The 95% upper bound for $\delta$ is $25.$ Our estimate is far
below this bound, and so we can believe that $\hat \delta = 8$
is consistent with no benefit from wearing masks to keep tigers
from killing villagers.
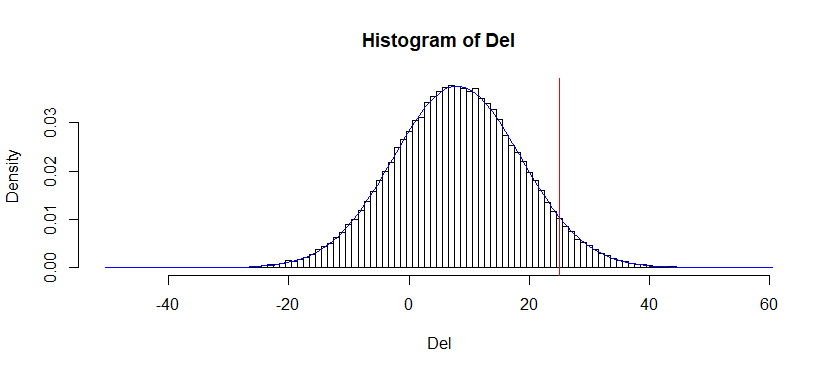
The histogram of simulated values Del of $\hat \delta$ illustrates that the sampling distribution of $\hat\delta$ is not far from
normal. The 95% upper bound is shown as a vertical red line.
hist(Del, br=-50.5:60.5, prob=T)
 abline(v=25, col="red")
 curve(dnorm(x,mean(Del),sd(Del)), add=T, col="blue")


