I am doing a Kruskal-wallis test and am wondering which post-hoc analysis is the most suitable for this? Been reading around and saw people recommend Dunn test. I am just wondering if there is any specific reason to not choosing something like Wilcoxon as they both non-parametric?
-
$\begingroup$ A concern in post hoc testing is to avoid false discovery, repeatedly testing the same data. Using 2-sample Wilcoxon rank sum tests with a significance level below 5% (as determined by Bonferroni's criterion) is certainly a choice. As I recall, Dunn's test has some sort of 'false detection' avoidance built in. $\endgroup$– BruceETCommented Mar 24, 2021 at 23:59
-
$\begingroup$ @BruceET Thanks for responding! Is there any resource I could refer to on this detail? $\endgroup$– Darren ChristopherCommented Mar 25, 2021 at 0:06
-
$\begingroup$ @BruceET Haha! I hope that will happen. I am not that active in this stack exchange stats, can I expect that user come in soon-ish? $\endgroup$– Darren ChristopherCommented Mar 25, 2021 at 0:13
-
2$\begingroup$ Have you looked at Related posts in the margin of this Question? That might be a useful starting point. $\endgroup$– BruceETCommented Mar 25, 2021 at 0:14
-
$\begingroup$ Sorry, that comment (now deleted) was part of another conversation. $\endgroup$– BruceETCommented Mar 25, 2021 at 0:15
2 Answers
As noted, in copious other places on Cross Validated, the Mann-Whitney (aka Mann-Whitney-Wilcoxon) rank sum test is inappropriate as a post hoc test following rejection of a Kruskal-Wallis test for two reasons:
The Kruskal-Wallis test statistic is based on shared rankings of all the data, but the Mann-Whitney test is based on rankings only of data for two groups at a time. This means that is a very real sense, the Mann-Whitney is using different data than the Kruskal-Wallis test. Dunn's test uses the same data rankings as the Kruskal-Wallis test. The strictly more powerful than Dunn's test (when used post hoc, following a Kruskal-Wallis rejection) but less widely known Conover-Iman test also uses the same rankings as the Kruskal-Wallis test.
The Mann-Whitney test does not use an estimate of the pooled variance as implied by the Kruskal-Wallis test's null hypothesis. This is analogous to the pooled variance used in post hoc pairwise t tests following the rejection of a one way ANOVA. Dunn's test uses an estimate of the pooled variance, as does the Conover-Iman test.
Dunn's test is based on an asymptotic normality (z distribution) assumption, while the Conover-Iman test is based on an approximately normal (Student's t distribution) assumption, and this is why the Conover-Iman test has more power than Dunn's test.
References
Conover, W. J., & Iman, R. L. (1979). On multiple-comparisons procedures (Technical Report LA-7677-MS). Los Alamos Scientific Laboratory.
Dunn, O. J. (1964). Multiple Comparisons Using Rank Sums. Technometrics, 6(3), 241–252.
Consider the following simulated data:
set.seed(325);  n = 30
x1 = rgamma(n, 5, .08)
x2 = rgamma(n, 5, .1)
x3 = rgamma(n, 5, .1)
x4 = rgamma(n, 5, .12)
x = c(x1,x2,x3,x4)
g = rep(1:4, each=n, notch=T)
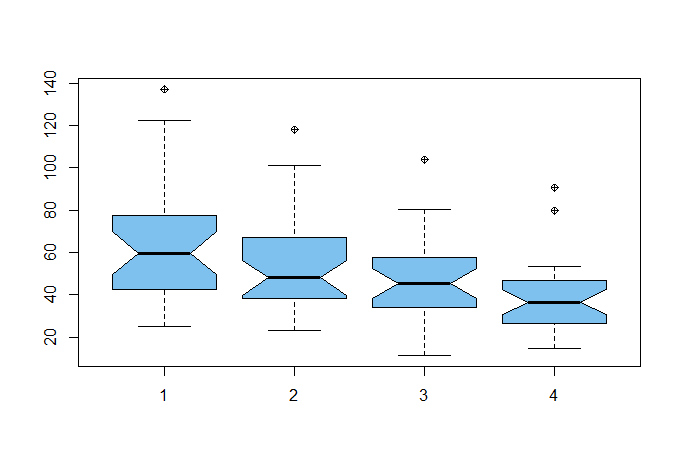
In R, 'notches' in the sides of boxes of boxplots are confidence intervals for group medians roughly calibrated so that, in comparing two groups, non-overlapping notches suggest significant differences in medians. So we guess than a Kruskal-Wallis test will show differences in locations among the five groups.
boxplot(x~g, col="skyblue2", pch=10)
kruskal.test(x ~ g)

        Kruskal-Wallis rank sum test

data:  x by g
Kruskal-Wallis chi-squared = 18.213, df = 3, p-value = 0.0003975
Ad hoc, two-sample Wilcoxon (signed rank) tests show some differences. The most obvious candidate for a significant difference is Group 1 vs. Group 5.
wilcox.test(x1, x4)

        Wilcoxon rank sum test

data:  x1 and x4
W = 712, p-value = 6.264e-05
alternative hypothesis: true location shift is not equal to 0
Some other paired comparisons between groups are show significant differences and some do not:
wilcox.test(x1,x3)$p.val
[1] 0.01364983
wilcox.test(x2,x4)$p.val
[1] 0.004313019

wilcox.test(x1,x2)$p.val
[1] 0.1193576
wilcox.test(x2,x3)$p.val
[1] 0.3504292
wilcox.test(x3,x4)$p.val
[1] 0.04788982
Beyond the obvious comparison, I have done five tests, so the Bonferroni method of avoiding 'false discovery' would insist of P-values below $0.01$ in order to be considered significant. Here that amounts to finding significances only between Gp2 & Gp4.
Because we are using simulated data we know that with sufficiently large sample sizes in groups we might have found differences between Gp 1 & Gp3, Gp 1 & Gp 2, and Gp 3 & Gp 4, but according to the Bonferroni criterion we did not.
With any scheme of ad hoc comparisons, it is unrealistic to expect to recover the exact true pattern of differences, unless a power and sample size procedure has prompted use of enough replications in each group to give sufficient power for that result.
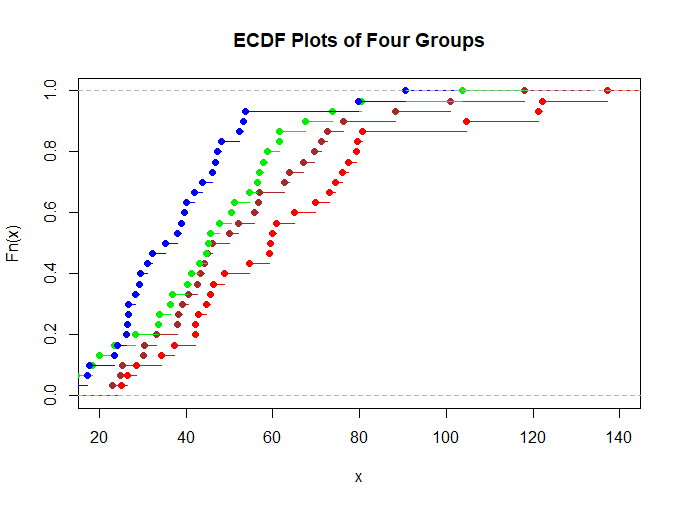
Because the the four samples are not obviously of the same 'shape' some might say that the Kruskal and Wilcoxon tests are looking at stochastic domination instead of shift of location. (Very roughly, one distribution dominates another if it tends to give larger values than the other.) By showing empirical CDF (ECDF) plots of the four groups we can try to judge stochastic domination. A dominant sample will tend to have larger values; hence its ECDF will fall consistently below that of another sample. Here are ECDF plots for the four groups in the current example (colors red, brown, green and blue for groups 1 through 4, respectively).
hdr = "ECDF Plots of Four Groups"
plot(ecdf(x1), col="red", xlim=c(20,140), main=hdr)
lines(ecdf(x2), col="brown")
lines(ecdf(x3), col="green2")
lines(ecdf(x4), col="blue")


