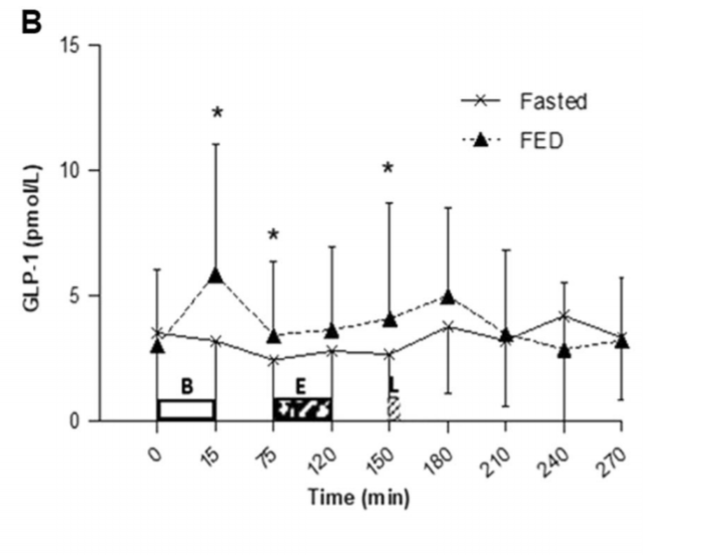
I am currently performing a meta-analysis where I am pooling area under the curve values.
For some papers I only have access to the figure. For example:
Using WebPlotDigitizer I can extract the mean and standard error/standard deviation at each time point. I can then calculate the mean area under the curve. However, I am unsure as to the correct approach in order to calculate a corresponding variance term.
Is it possible to use the values depicted by the error bars at each time point to calculate an estimation of variance for the area under the curve?

